Airbourne’s Carbon Footprint 2025

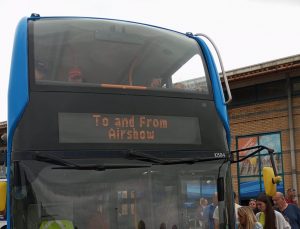
For the first time, Eastbourne Eco Action Network (EEAN) Transport Group has undertaken a survey of the carbon footprint of the audience, going to and from Airbourne, which is also referred to as the Eastbourne Airshow. In the past EEAN have estimated the carbon footprint based on Eastbourne Borough Council (EBC) surveys and from other external sources.

The provisional Carbon Footprint for the Audience, from this survey, is estimated at between *3,500* and *4,000* tonnes CO2e  depending on the assumptions used. Different carbon emission models, the  allocation of a trip within a holiday to Airbourne, vehicle occupancy, multi stage trips, all  affect the data. It should be noted that this range is lower than the estimates, in past years. So a review should be carried out by EEAN, when EBC undertake their own analysis for 2025, to cross check and validate this report

However in undertaking this exercise, there were some shortcomings in the approach, that could be addressed next time. Mainly around more accurately analysing people who are coming to Airbourne from the holiday location and not directly from their home. This is covered in the section “How we should have done the survey” . So a blue print for what we could do in 2026 to improve the research.

Background

EBC’s Events Department state “[We] work pro-actively in our approach to sustainability at all of our events including Airbourne. We strive to ensure that sustainability is at the forefront of our decision making as opposed to being an afterthought. Airbourne brings a significant number of people into our town over the course of four days and we try our best to make our event carbon friendly.”

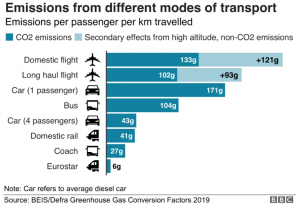
“Only 3.7% of emissions generated by Airbourne are from the flying display aircraft.  In fact, all of the displays in total generate less than a one-way flight to New York! The biggest generator of all emissions is actually from the people travelling to events, with 96.1% of all emissions at Airbourne 2022 generated by audience related travel, and just 0.2% from other sources.”

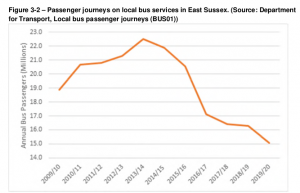
From the EBC 2023/24 Carbon neutral report.  “The council has now collected two years’ worth of data from the Airbourne airshow … The visitor survey was particularly successful this year having 1896 responses. As we estimate audience travel based on visitor numbers of 750,000 people, the more people that complete the survey and give us actual information, the more realistic an estimate we can make. Total emissions this year have been calculated as 5479  tonnes, a 12.8% reduction on 2022.”  (Around 96% of this is down to audience travel so this is **5250** tonnes)

Survey Results High level

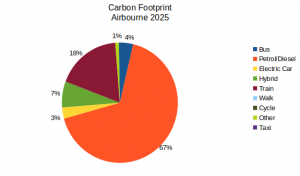
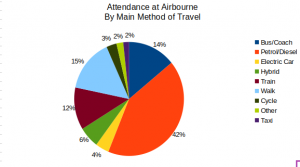
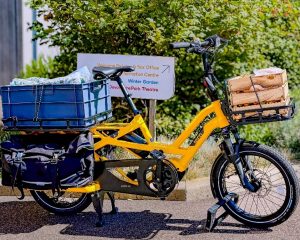
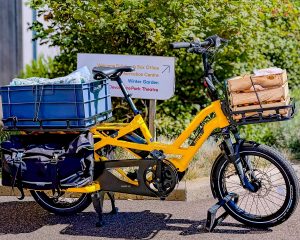
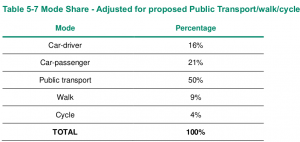
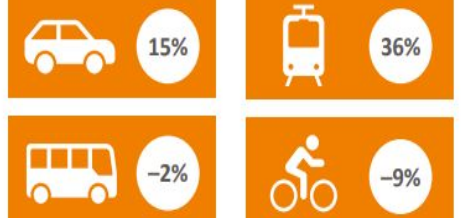
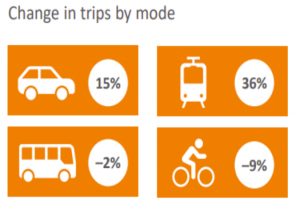
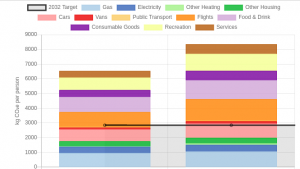
The largest number of attendees come by car using diesel or petrol, and this is reflected in the charts below . There are a reasonable number of people who use public transport, walk and cycle all of these have lower carbon profiles

Carbon Footprint Assumptions

One problem, for anyone estimating the carbon footprint, is choosing what ‘calculator’ to use . Different organisations vary in their assumptions

Approaches to be considered may include

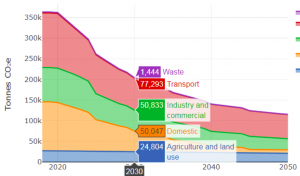
      • Count all electric vehicles as having zero tailpipe emissions, so no CO2, in line with the the UK emissions by Council 2005 to 2023 , which excludes carbon emissions of any electric transport ( Electric Vehicles, trains, and e-buses ). They also count, over a year, only the distance covered within Eastbourne. So much, of Airbourne’s journeys, will be allocated to the District Councils of Lewes, Wealden and Rother.
      • Including the whole trip ‘door to door’.
      • The whole trip, as in the above, but with all the elements of manufacture, disposal and indirect elements
      • Allocating CO2 for visitors from long distances, who then stay locally. Where they then have short trips to Airbourne where they might cycle or walk, each day, to the event.
      • Regardless the type of car, the larger the vehicle, generally the higher the emissions. Families may choose their largest car for this journey
      • Factoring in ‘Stop start’ journeys, with a different CO2 profile to motorway driving.
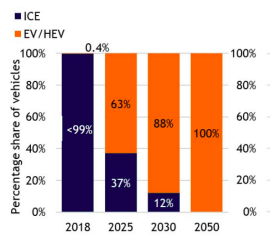
      • There are three main types of hybrid: mild , full , and plug-in. Each with a different CO2 profile though here an average of all 3 is used.

Different Calculations for Carbon Emissions

In this report the TNMT approach, is mostly used.

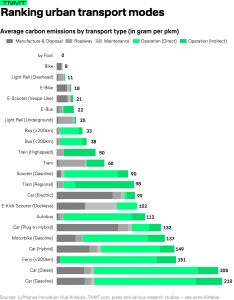
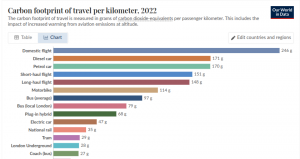
‘Our World in data’ , which is based on UK Government data, tends to be lower. The main difference is around trains where TNMT will include more indirect factors around the infrastructure running a railway.

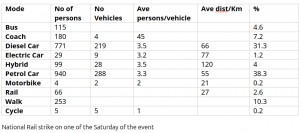
However at Airbourne, there were higher levels of passengers in buses, trains and cars than for an average journey. This could be reflected in the carbon footprint per passenger. The occupancy rate for cars was just above 3.

There will be trains and buses returning that are not full. Likewise the ‘Park and Ride’ buses were probably running one way with 50 passengers and with very few on the return. Many local buses were so full at times that they drove past waiting passengers

One approach, used in the first iteration of this report, was to calculate the carbon for each vehicle occupant and gross this up for all those involved in the survey. This did not give a significantly different answer than the simpler method of using one person per private vehicle and then adjust later for the sample size.

So, as explained, the TNMT model has additional CO2 for electric vehicles, because of the manufacture and disposal, especially of batteries. Plus the carbon for electricity is very dependent on how green the grid mix is.

Survey analysis

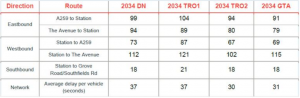
Many people will attend on multiple days and any count is difficult, as there is no controlled access to the event . In the survey, people could describe two methods, they used to get to the event. For the ‘main method’ of transport the estimate for Carbon is 3150 for an assumed audience of 750,000. (There may be in the table some rounding errors).

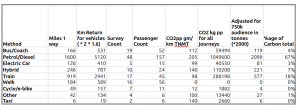
Total 3,150 Tonnes CO2e

      • Miles 1 way – Reported journey for survey in miles – as this is easier for the public to describe their trip there
      • Km Return for vehicles – Converting into kilometres and then doubling for return
      • Survey Count – Those who describe their ‘Main Method’ for each transport method
      • Passenger Count – The passengers for the ‘Survey Count’
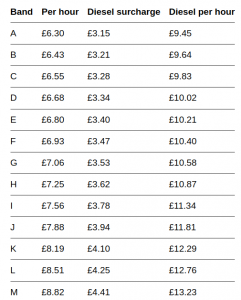
      • CO2 pp gm/km – CO2 per passenger (person) per kilometre (TNMT)
      • CO2 kg pp for all the journeys. Km return * CO2 pp converted into Kilograms
      • CO2 tonne for 750,000 – 750,000 is an estimate used by EBC for attendance ( 372 people in survey * 2000 is approx 750k) Then converted into tonnes
      • Petrol/Diesel – Private Cars with Internal Combustion Engine
      • Other – A mix of methods including powered wheelchairs, motorbikes and larger vehicles
      • Hybrid- An average of different types of hybrid – as not differentiated in survey
      • Taxi – Assumes mostly hybrid cars.

Many people will have multi ‘stage’ trips to get here. Estimates of the ‘second method’ will therefore be for a shorter distance. This will include those visitors who may have come a long way away but are staying reasonably locally and their journeys on these days are less, perhaps using Park and Ride buses, or local buses from the station or town centre. A rough estimate is around 350 tonnes . So the total for all journeys is close to 3,500 Tonnes. ( 3150 + 350)

There is no strong confidence attributable to this figure, as the 750k audience is an estimate and the sample size is small.

Survey questions

Two members of EEAN Transport Group did the interviews. This has the advantage that the interviewer can extract from the conversation the key pieces of data.  They tried to make the sampling as random as possible, by time of day, day of week and location. Having only 128 surveys for 372 people is not enough. The technology was a web-link with 3G on mobile phones to a Google form that feeds a Google Sheet .

Comparison with Eastbourne BC data 2022.

It is assumed that the EBC data is all collected from the online feedback form. It is possible that those strongly motivated or financially affected by the event, will be more likely to complete the survey. So for example the figure of 4 coaches with 180 passengers scaled up to 750,000 people would be a very high 40,000 passengers and 1,000 coach trips. It is assumed that the coach operator completed the survey rather that a random sample of the audience, which would be more in line with the EEAN survey. The coaches appearing to have much higher passenger numbers than those using local buses.

Likewise those who are local and less interested may spend only a few hours but on several days. They may be less likely to fill in the questionnaire. Their day may also include work, leisure and shopping and although perhaps driving to town they walked to Airbourne. The average distances are therefore higher with the EBC ‘model’ than in the EEAN survey.

How we should have done the survey

There were some good elements such as capturing multi stage trips.  For those staying locally the current questionnaire failed to tease out all the complexities of the trip for each day at Airbourne. The questions would be improved by asking

      • How far did you travel, from home to your holiday destination (Miles)
      • How did you get to your holiday destination
      • How many days are/were you on holiday
      • Of these how many are coming to Airbourne
      • How far did you travel, from where you are staying on holiday, to Eastbourne seafront (Miles)
      • How did you get from where you are staying today

Authors – Paul Humphreys and Derrick Coffee

Bus Into The Future !

New (almost!) double decker buses have appeared on the Stagecoach Eastbourne route 1A in recent weeks, featuring audio announcements of next stops. This is very important for anyone with sight impairment, but reassuring for everyone on the bus – especially those new to bus travel or unfamiliar with the area. In due course, all buses will be required to install this facility giving us a ’step change’ in the quality of bus travel. The display on the front of these buses is in clear ‘white on black’ type, a departure from the current coloured type. Seating is comfortable and charging points standard.

New Improvements

ESCC EVENT- DISPLAYS ON SHOW:
Other improvements are to follow in due course including those unveiled at County Hall in mid-January. An invited audience of groups and individuals saw examples of bus stop information displays designed to help those with sight impairment, while benefiting all users. A large number of bus stops in East Sussex, Brighton and Hove (220) will see these installed, including an audio version with instructions in braille.

Maintaining and Improving Reliability of our Buses

Services restored and increased though the Bus Service Improvement Plan (BSIP) over the last year have added journey opportunities and attracted new passengers. Their voices are now heard through bus user groups set up in Eastbourne and Hastings areas where concerns are aired and opportunities for improvements discussed with local authorities and bus operators. Improvements there certainly have been and more are in the pipeline with bus priority measures coming for Eastbourne to benefit bus services on the Hailsham – Stone Cross – North Langney – Seaside corridor as well as the Hailsham – Polegate – Willingdon – DGH – Eastbourne corridor. These are congestion busters!
BRIGHTON. AND HOVE ‘COASTER’ SERVICE 12 PASSING EXCEAT - SEVEN SISTERS COUNTRY PARK
BRIGHTON. AND HOVE ‘COASTER’ SERVICE 12 PASSING EXCEAT – SEVEN SISTERS COUNTRY PARK
To the west, the success of the popular Brighton and Hove 12/12X13X routes is worthy of note. The proposals between Eastbourne and Brighton are key to its continuing success and development against a backdrop of congestion hotspots, so we strongly support those measures proposed for: A259 Upperton Road – Station Parade, Eastbourne; A259 Newhaven, The Drove – Denton Roundabout; A259 Telscombe Cliffs – Peacehaven.

Conclusion

Buses are certainly getting better: wi-fi is now standard along with the ‘kneeling’ function to allow easy access for all. Derrick Coffee EEAN Transport Group

Latest posts

Franchising or Enhanced Partnerships?

Deregulation

By the 1980’s bus services in England were in decline, with rising costs, increasing subsidies and so in order to address this problem the government of the time decided to deregulate bus services. This meant that private bus operators were allowed to set up bus routes, timetables, services and fares. This process was not a disaster, but the ever-increasing popularity of the private car weakened the need for buses. What we have now is a patchwork of bus operators who prioritised the most profitable routes at the cost of reducing services on less attractive routes such as those in rural areas. Bus companies do not have to make all their bus routes profitable and to their credit they do run some routes at a loss paid for by more profitable routes. Currently most bus routes in the Eastbourne and South Wealden area are operated by Stagecoach but East Sussex County Council (ESCC) subsidise some non-commercial bus routes mainly in rural areas, additionally ESCC also operate the free bus pass scheme for older people.

Bus Back Better

Buses are the most important form of public transport in England accounting for 53% of public transport journeys. But the number of bus users and bus miles is falling. In 2023 bus passenger numbers fell to 3.4 billion from 4.6 billion in 2009. In March 2021 the Department for Transport announced their plans to improve bus services in England via ‘Bus Back Better’. This resulted in roll out of Bus Service Improvement Plans including Enhanced Partnerships (EP) and franchising options, but very few bus franchising schemes have been introduced.

What is an Enhanced Partnership (EP)?

An EP is a model through which the local transport authority and bus operators jointly agree a plan to improve bus services. The plan is a voluntary arrangement and attracts funding from government. East Sussex County Council currently operate an EP with declared aims such as: • Improving fares and ticketing • Improving bus infrastructure • Introducing bus priority measures • Reduce harmful emissions • Improve digital accessibility • Improve public transport information
Inside of Bus
Inside of Bus

What is Franchising?

Franchising is a model of providing bus services where Local Transport Authorities (LTAs) such as county councils take control of how buses are run, this could be on a specific route or a particular area and ask bus operators to bid to operate these routes. The LTA would specify the route, frequency of service, timetable and fares. The current government is keen to further improve bus services and so is encouraging LTA’s to introduce franchising schemes. Franchising is not a new idea and is the model currently used in London, the Channel Islands and in many regions and cities in Europe. Greater Manchester has, this month, just finalised the third tranche of their franchise network and Liverpool are well underway in their planning.

Why we need good bus services?

Bus Stop
Bus Stop
• There are many people in society that do not have the luxury of having their own car or motorcycle and to them good bus services are vital. • There are those that are unable to drive or are too young to drive, they too need good bus services. • Buses connect our communities and allow access for many to health, leisure and education services. • Good bus services can also get people out of their cars and so free up road space which will assist in making buses more reliable. • Using buses will help us reach our carbon reduction targets. • Less traffic on our roads will lead to less pollution. • If bus services become more profitable through greater passenger numbers, then funding can be invested in electric buses. Cambridge and Peterborough consultation document

Some thoughts:

• Analysis seems to show that franchising brings more benefits. • Enhanced partnerships will mean less financial risk to transport authorities. • In a shrinking economy can we afford to place a greater financial burden on local authorities? • The main opposition to bus services is the private car, which is just too convenient, this will not change without a huge shift in public values which is not going to happen soon, if at all. • Do local transport authorities have the expertise to operate bus ticket strategies, bus fare policy, network design, bus timetables etc? • The setting up of a franchise scheme would have very large set up costs. • Perhaps a compromise position could be reached whereby some areas have a franchise scheme while neighbouring areas have an Enhanced Partnership? • Most franchising schemes that are currently in place or are being planned are in locations with high population densities such as Manchester and Liverpool. East Sussex is very much a rural area and hence will be more costly to operate a bus service.

Unitary Authorities

In January 2025 East Sussex County Council applied with West Sussex County Council and Brighton City Council to become a Mayoral Strategic Authority. It is reported that this could unlock significant power and resources to these areas. Transport could be one area to benefit if more funding becomes available as the authority could potentially introduce franchising schemes.

Conclusion 

At the end of the day either the Franchise or the current Enhanced Partnership model will improve bus services in the area. David Everson Eastbourne ECO Action Network Jan 2025

Latest posts

Transport/ Planning Integration

Transport and Planning integration is the key to a sustainable, healthy future. In the big battle against climate change, the one missing yet key weapon in the armoury, accepted by all policy makers for decades but infuriatingly absent in practice, is the full integration of ’transport’ and ‘planning’. We must abandon ‘silo thinking’ around ‘transport’ and ‘planning’. They should be integrated to avoid the procession of car based developments being delivered across the UK. Until that happens, we won’t increase the take-up of shared transport (bus/train/tram) and increase levels of walking and cycling necessary to meet targets. At the same time it will improve the nation’s physical and mental health. 
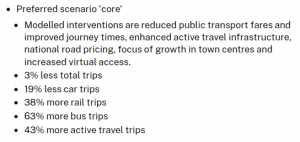
Fewer cars will free up space for nature, housing, business and children’s play and reduce congestion. Policy documents have recognised this over 50 years: delivery on the ground is sadly the exception. The new National Planning Policy Framework (NPPF) must deliver such integration if it is to be fit for purpose. Failure to do so would be unfair both to current and future generations. Based on a letter published Jan 2025  in iNews   Derrick Coffee

Latest posts

Let’s try and agree on new transport schemes

There has to be a better way to implement new transport schemes, than making two sets of campaigners, fight it out.

Seaside

The contentious Eastbourne Seaside bus lanes, which have now been agreed by East Sussex County Council (ESCC), still have to be redrawn and then go back to the Department for Transport , for a third time, for final sign off. Large amounts of money have already been spent on redesigning, two consultations, micro modelling traffic flows, health and safety and equality assessments . All this while nothing has been built and a year has gone by.

Non Bus Lane Options

However is seems that outside of the formal process it is possible for the various campaigning sides to agree what they think would work.

In terms of the £41M Bus Service Improvement Programme (BSIP) measures this includes:-

A scheme, proposed in the BSIP consultation, of a 100m ‘bus gate’ at then end of Atlantic Drive and the Crumbles, that would join the North and South harbours for buses. Perhaps a modified version of the 5 and 5A could then run along the seafront and through the harbour. This could lead to a faster and more regular service for the new housing developments.

Priority Traffic Lights for buses, where they actively change the lights, to let them through. You can see the idea at Huggetts Lane in Willingdon , where lights miss a phase if nobody wants to turn right or the green light stays longer if more traffic is on one direction. This makes the traffic flow better. Now add in the detection of buses and perhaps have longer, or earlier green phases. Of course the other vehicles on the same carriageway would also benefit. ESCC have £1.5M for 34 locations where there will be priority lights. Let us make the most of these time savings.

These are both examples of widespread support. There is then less likelihood of campaigners disagreeing and more of the tight budget will be spent on actually building schemes.

Cycling

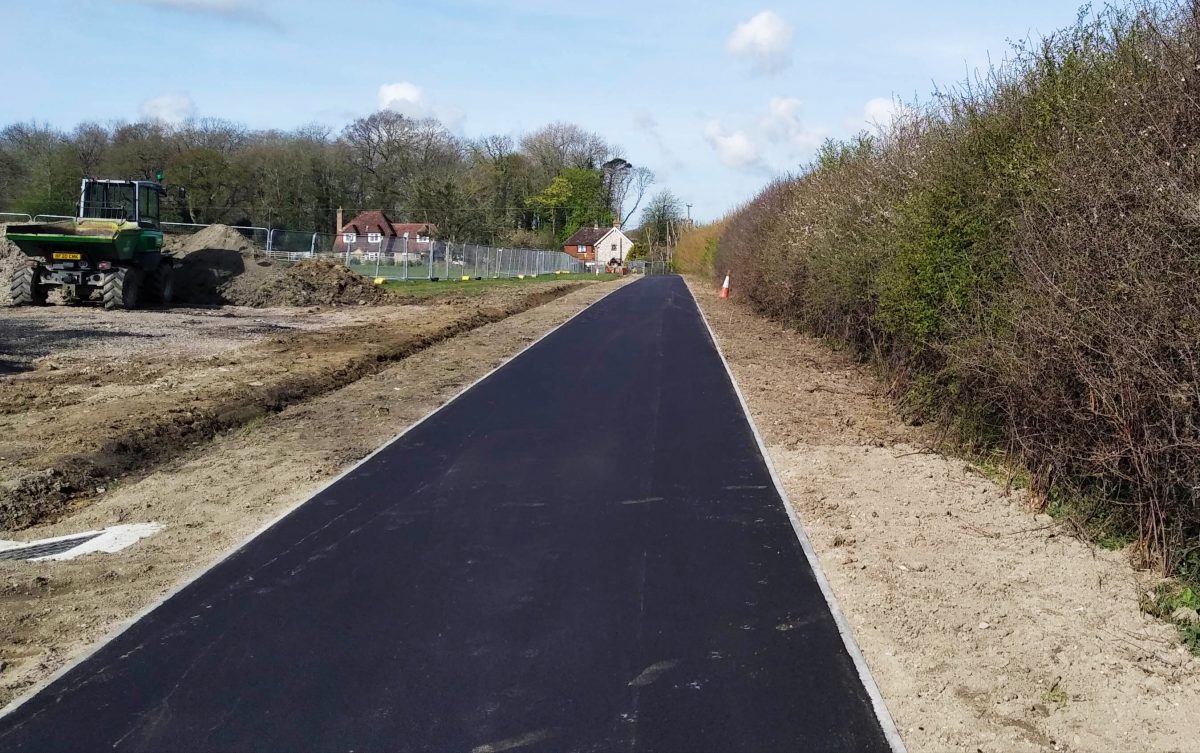
The same idea should also be used for cycle routes, where there is a often a consensus, that off-road routes do not cause issues for motor vehicles. Such successful schemes include Horsey Sewer, Cuckoo Trail and the A27 shared path to Firle. So let us prioritise these where possible, instead of contentious and poorly configured solutions that are ‘shoehorned’ into narrow spaces on roads and footways.

Based on letter in Eastbourne Herald and Sussex Express ( on line)

Paul Humphreys – EEAN Transport Group

New Houses need more Solar Panels

What a wasted opportunity! Thousands of new houses are being built in South Wealden without enough solar panels. Very similar in Eastbourne where apart from small schemes, houses are being built with either no or inadequate solar. This being the sunniest place in the UK!

Background

The price of solar panels ( Photovoltaic PV) keeps dropping dramatically . So why do local councils not influence builders in making the most of this clean energy?

It would make sense to reduce electricity grid demand by ensuring that all our newly built homes have enough solar panels. This does not appear to be happening. Where they are included, there can be as few as 2 panels and no battery. This would provide up to 1kW. This is barely enough to run a toaster.

Eastbourne’s previous MP, Caroline Ansell, in 2022 backed a bill, to make solar panels mandatory on new homes. “Solar costs have fallen by 50 per cent in the last seven years and I believe it is now the right time to ensure developers put this technology on all new homes. This is a win for homeowners and the planet. Installing solar is green and it will cut energy costs for people when gas and electricity prices are high and will remain so for some time.”

Sunsave says “The benefit of legally mandated solar panels on new builds in the UK would be enormous, and it seems to be on the horizon. However, until that time, it’s crucial that developers refrain from putting a pointlessly small number of solar panels on the roofs of new properties, as this only causes headaches for homeowners further down the line. “

Locally

Hindsland – Eastbourne Road Polegate

Some developers are doing well and some not. Here is an example in Hindsland (Polegate) . There will be 180 houses, where each unit, has around 2 solar panels. Next to it will be Mornings Mill with 800 units. Let us hope this will do better.

In the main picture is an estate in Hellingly. These houses have 4 to 6 panels. However on the other side of the road is a huge estate with next to none.

Building Regulations

So solar panels aren’t compulsory on new builds. They have become a common way for developers to meet certain building regulations. Many builders choose to install them in order to meet the required SAP (Standard Assessment Procedure) score for energy efficiency.

By incorporating solar panels in the roof, developers enhance the property’s energy performance and raise their SAP score. This score is a calculation of its energy cost performance and renewable energy sources. Each building’s SAP score is then used in its Energy Performance Certificate (EPC) rating.

SAP scores are on a scale of 1 to 100+ with higher scores indicating better energy efficiency and less environmental impact. A score of over 100 would mean that the property’s net cost of energy over the year is nil, perhaps due to exporting back to the grid.

According to the UK Government’s most recent survey, the average SAP rating was less than 70 points. So how do developers get a higher score?

      • Walls, roofs, and floors are well-insulated
      • High-efficiency boilers or heat pump
      • Solar panels
      • Using double/ triple-glazed windows LED lighting
      • Mechanical ventilation heat recovery (MVHR)
      • Less heat loss by design & construction
      • Smart thermostats & heating controls

So solar panels are just one way to increase the score. But adding only 2 panels can have negative effects. One common problem is that developers don’t use all the available roof space. The property gets a higher SAP score but with only a few panels the actual impact on energy bills is negligible.

This can then create challenges if the homeowner decides to expand their solar panel system. Sometimes the original panels might be sunk into the roof and will need to be removed, to allow for a larger system, which adds to the total cost.

From the house to the Power Grid is becoming bi-directional (From Octopus )

Often the developers will provide an EV charger, for each house, but this will need to use the national grid . What a waste ! When more panels and batteries could result in free power. The idea of ‘National Grid 2.0’ allows for electric cars with solar panels and a battery, to export excess energy and provide enough household energy for up to a week.

Conclusion

Many developers appear to be installing as few solar panels as possible. This will not support net zero.  There should be a minimum number. Perhaps  4 panels  in a ‘standard house’ with even  more in larger ones.

Paul Humphreys – EEAN Transport Group


New Bus User Group for South Wealden and Eastbourne

Guest Blog by David Everson

The importance of bus services in and around Eastbourne was a major topic at the initial meeting of the Eastbourne Area Bus Users Group (EABUG). This event took place in Eastbourne Town Hall on 16th October 2024. The group is an initiative of the Eastbourne Eco Action Network (EEAN). It aims to provide an interface between bus users, bus companies and local authorities. EABUG plans to meet three times a year.

Prominent among those present were representatives of local bus companies, Stagecoach, Brighton & Hove and Cuckmere buses. Also present were representatives of local disability groups, local and county councillors plus members of the public.

Jill Shacklock and David Everson (EEAN) both highlighted the need for good bus services. This was for those who could not drive or afford to drive, school children, those with disabilities or the elderly. They also emphasised the need to develop good sustainable transport systems.

East Sussex CC

A member of the East Sussex  Bus Team, Donnalyn Morris, gave an update on a variety of infrastructure projects that had been taking place in Eastbourne and Friston. Work on the Hailsham Mobility Hub was yet to start, with discussions currently taking place with Tesco about the project. The consultation about the proposed Bus Priority measures along Seaside and St Anthony’s in Eastbourne had now completed and a decision would be made in November.

Stagecoach

Matthew Arnold, Commercial Director, Stagecoach South East expressed concern over the detrimental effect that congestion had on bus punctuality and highlighted problems in Eastbourne. He described  these as the worst in the south east. He stated that car traffic was up 15% on pre Covid levels whilst bus passenger numbers had only risen to 94% of pre-Covid usage.

In addition, he also stated that buses were hindered by lack of co-ordination in the planning of roadworks. There needed to be more advance information sharing between ESCC and utility companies.

Brighton & Hove

Ben Garcia, from Brighton and Hove Buses, informed the meeting of recent improvements to their bus services. They are now a UK lead when it comes to inclusivity on their buses. They have dementia friendly seating and their drivers are trained to be ‘Dementia Friends’. All their buses are ‘talking buses’.

Cuckmere

Nick Price from Cuckmere Buses informed the meeting that their operation of eight, 16 seater buses were all driven by volunteers and that their new timetables would be published soon.

The main body of the meeting involved presentations, discussions and workshops about ‘Accessible Information’ on buses. New legislation requires most buses to provide information to passengers about the bus number and route and next stop information. Importantly the information must be given both visually and aurally. The new legislation came into force on 1st October 2024 for buses registered after October 2019. Older buses that need to be retrofitted with display boards and sound systems must be accessible by October 2026.

Using Apps

During the meeting there was a short presentation on how to use both Stagecoach and Brighton & Hove Bus Apps. QR codes were also highlighted as a quick means of accessing information at bus stops. A limiting factor for both of these sources of information is the necessity to have a Smart phone to access it.

Next Meeting

The next meeting of EABUG is planned for February 2025.

For further details please visit – Eastbourne ECO Action Network.

https://ecoactioneb.co.uk/about/eastbourne-area-bus-user-group

Email : bususereastbourne@gmail.com

David Everson

(Chair EEAN Transport Group)

Bus Lane Consultation – Seaside and St Anthony’s

Introduction

Guest Blog by David Everson – Chair of the EEAN Transport Group

Information for those wishing to complete the ESCC Bus Priority Measures consultation for Seaside and St Anthony’s, Eastbourne, which closes on 18th August 2024.

The consultation documentation can be found by following the link below.
Bus Priority Consultation

The EEAN Transport Group support the revised proposals for Bus Priority Measures and would encourage as many people as possible to support the plans in a positive way.

As we look to the future, we need to encourage the use of mass transport systems such as buses to reduce congestion on our roads. Bus can be used by most people including the young and old who are not able to drive a car, or other sections of the community who cannot afford to drive.

Key points 

  • The plan to spend £3 million is a significant investment for Eastbourne and will help the town move towards sustainable transport in the long term.
  • The plan will reduce bus journey times through the proposed bus lane area particularly at peak times making bus use a more attractive option for travellers.
  • The introduction of several pedestrian crossings will improve pedestrian safety and assist those who walk to bus stops.
  • The bus lanes will take up some road space and the amount of parking along Seaside will be reduced. However, surveys carried out by ESCC indicate that sufficient parking will remain for both residents and local businesses.
  • Traffic flow through the project area will be eased and so reduce congestion along Seaside and St Anthony’s. This will make buses more reliable.
  • If passenger numbers increase due to the bus priority measures, then bus companies will be more likely to invest in more buses on routes.
  • If buses are not hindered by congestion, then it is much more likely that bus companies will invest in electric buses which will assist in efforts to decarbonise our transport and improve air quality.
  • There is no evidence that the introduction of a bus lane will damage the viability of local businesses, in fact studies have shown that bus lanes can increase footfall for businesses along routes.
  • Eastbourne is one of the most car dependant towns in the South East of England and the provision of bus lanes will encourage people on to the buses.

ecotransportgp@gmail.com
August 2024


Reporting Potholes

Introduction

The number one current issue for politicians, councils and much of the public is potholes. They are an important issue for drivers but also pedestrians and cyclists. They damage vehicles, cause accidents, and lead to expensive repairs . We must work towards creating safer roads and one solution is for residents to contribute to an online database.

Bespoke and Eco Action Eastbourne are experimenting with ‘Stan the App’. It is easy to use and utilises ‘cutting-edge computer vision technology’ to identify road defects, such as potholes, with remarkable accuracy. Just by driving  you help to build a comprehensive database of road defects, enabling the prioritisation of repairs more effectively.

Damage

National Pothole Day revealed 21% of UK cyclists had accidents caused by potholes. This was evident when Bespoke Cycle Group, for their Kidical Mass ride, had to change the route to avoid the worst potholes in town. Many of the faults had been reported to https://live.eastsussexhighways.com/report  but there is no way of knowing when the issue will be resolved and sometimes unclear if someone else has already reported it. Or you could use https://www.fillthathole.org.uk where you can report a range of other issues on roads and cyclepaths. The system will then pass on your report to the relevant council.

With Stan, every pothole ‘reported’  adds to a more detailed picture. The system uses all the reports to show how big the problem is. It empowers residents to become highway surveyors and holds authorities accountable for road repairs.

In neighbouring West Sussex there was a focus on four towns. The worst of them was Worthing, where the comprehensive road map is still shown heavily in ‘red’.

The easiest way to get involved, is simply download the app to your phone and then record a video of your journey. The app will only upload when you use your wifi. A short time later the system , through AI, has worked out the road defects and added them to the UK map. There is an other option of taking photos and this may be more relevant for cyclists. The system knows where you are and once again you just upload when it is convenient.

There are other apps out there, but it will be more effective if everybody uses the same one and Stan is the RAC’s official pothole reporting partner. You can download the application from both App store and Google Play.

Future Action

In a few months time, the idea would be to write a report for councils and politicians to give them the information they need to get crucial repairs done. It may be that East Sussex Highways would then use it as a source of information

If you are interested in getting involved and want further information, videos and case histories go to http://www.stantheapp.com.

Notes

This article was submitted to Eastbourne Herald but here is some further content. If your internet connection is slow uploading content can take time. However with reasonable bandwidth unless you have recorded a long trip it should be okay. Generally video the routes you have not recorded before. Still experimenting if H.264 or H.265 is best for the video.

In photo mode try to include something that would give the pothole a scale . So perhaps a car wheel, kerb or road marking. Otherwise hard for the system to assess the pothole size.

West Sussex

Here is an example from Worthing of what is possible when residents are involved – Red is a serious problem and Green is okay.

Eastbourne

Here is the starting point with only a few people using the app. Note how around the Golf Course is poor and incomplete. However after a few days it  seems to have filled in the whole route so be patient.

Cycling notes

Trying to record video while cycling, even on an MTB with suspension, may have poorer results. It will not record if going too slow and may struggle with media content that shakes. The system also appears to reject many photos even where there are serious potholes. Overall the effectiveness of uploading data from driving seems higher

Paul Humphreys – EEAN Transport, Bespoke Cycle Group, Cycle East Sussex

Making business a force for good

At our recent Carbon Neutrality Symposium held at Eastbourne Town hall on 20th April, our keynote speaker, Richard Garland, a prominent local business owner, gave an inspirational talk about how local businesses can make a very significant contribution towards Eastbourne becoming a truly Carbon Neutral town by 2030. Below is an abridged version of his speech:

 Good afternoon, everyone. I am Richard Garland, and amongst other things I am co-founder of Gradient Consultants. We are chartered surveyors, project managers and compliance consultants, based here in town since 2004. Some of our projects you may be familiar with include the Fishing Quay development on Sovereign Harbour, Costa Drive-thru on Hampden Retail Park and the affordable rental flats in Southfields Road. In 2020 we certified as a B-Corp, the first independent company in Eastbourne and one of the first UK built environment professional firms to do so. B-Corp is a global movement transforming the economy to benefit ALL – people, communities and the planet. We still have to make a profit but the way we go about it isn’t about making profit at any cost – everyone has to benefit along the way. 

Our purpose is our commitment to making a positive impact on the world. As a certified B-Corp, our values are deeply rooted in sustainability, social responsibility, and ethical business practices. We believe what we do in the next 7 years leading up to 2030 really matters and now is the time to act, with our industry being responsible for over 40% of the UK’s carbon emissions. We consider ourselves carbon neutral through our support of Ecologi. Ecologi®  have achieved the Verified Carbon Standard (VCS) and have been our offsetting partner for a number of years. We currently offset the business and personal emissions for all our people . We support tree planting and ecological schemes across the world. In the last 3 years we have offset 138 tonnes of carbon, planting over 2000 trees, and supported global sustainable projects. Our goal is to retain this off- setting, regardless of emissions reduction , but bring it closer to home, which we have already started to do by supporting planting on the Eastbourne escarpment. But we want to go further…

In 2022 we decided to set our ambitions on Net-Zero by 2030. We recognised that at some point in the not too distant future Net Zero will be the new carbon neutrality, so we wanted to be ahead of that journey. We started looking at data collection. I cannot begin to tell you how many articles on how to measure, what to measure, and when to measure from, we read – and at one point we got analysis paralysis – just stuck! And it took a friend to simply say stop thinking and just do something, anything – even if it is simply to walk to work and then make that your first action! This was a bit of a light bulb moment and as long as we could evidence a robust source of data it was worth doing something positive, rather than worrying over the how! We looked and celebrated what we were already doing, which included recycling pretty much everything, making sure our unwanted IT equipment and furniture goes into the circular economy, and pushing our clients to install bee bricks, swift boxes and fruit trees onto their development sites. 

Calculating our Scope 1 and 2 emissions was relatively straightforward for us as a professional services business so I won’t dwell too much on it- the biggest change is the utility companies will help you with this so it is much easier to deal with. In conjunction with our landlord we now have an office that has solar panels, LED lighting, infra-red heating panels, additional roof insulation and film on the windows to reduce solar gain. As for the dreaded Scope 3 emissions, for a firm such as ours this is where the majority of our emissions lurk and a challenging area for organisations in terms of data collection and carbon reduction initiatives. From travel to water to the things we buy, the list was long but eventually we agreed a more manageable list of priority measures, assisted by Small99. Our Pathway to Net Zero covers short and longer term planned activities to reduce our business ‘and personal’ GHG emissions, as well as push for a greater reduction in the emissions of the projects and services we advise on and can influence. At the last count there were 50 + ideas and actions. The priority ones get a champion, an estimated date for achievement and the emission saving impact. As a result we now use local suppliers as a priority. Local sourcing helps us reduce our carbon footprint and supports our community and local economy. We specify nature based materials, including hemp, lime and we now specify Graphenstone paint for all our projects. This paint absorbs CO2, removes pollutants to purify the air and as a mineral based paint it contains no microplastics. We hold our business event at venues close to a train station to encourage guests to make sustainable travel choices.

And we waved goodbye to our computer server in October last year, which was no longer needed since moving to the cloud as one of our reduction actions. The server had been running continuously for 6 years and by retiring the server we are saving 118 kgCO2e per year. The biggest impact on the list we are currently addressing is banking and pensions. Moving these financial instruments has the potential to have the greatest impact of all – a sustainable pension is 21 times more powerful than giving up flying, becoming vegetarian and switching to renewable energy.  Our goal is to make a 10% CO2e reduction year on year from 2024 to 2030. This will have reduced our overall emissions by 70% by 2030. With the Scope 1 and 2 emissions reduction prior to 2023 we believe we can achieve the necessary reduction in emissions to at least try and hit Net Zero by 2030.

So why do this, what and who benefits? B-Corp gave us ‘a legal high, we started to see ourselves as activists and ethical leaders. For us it is a climate justice choice . As a business we are de-risking the need to meet current and future compliance requirements within our industry , and we are acknowledging the opportunities of the low carbon transition – the green economy. For example, retrofitting the UK’s existing building stocks, measuring the Whole Life Carbon costs on construction projects, and the impact of Net Zero building standards, are all opportunities for sustainable growth and meeting future Department for Energy Security and Net Zero targets. Clients need us to have taken action because their funders (banks, pension funds, government) will be demanding it of them. We are influencing our supply chain to take action before they require it of us and we are offering to assist them with that change – openness, sharing ideas and transparency will make the journey go quicker! And to close, my advice to anyone at the beginning or on this journey is: do not over-strategise and get stuck in the data. Imagine if we did nothing and just talked about it? Look at what you have done so far, celebrate it and then take another step on your journey – be a force for good whatever you do!

We are grateful to Richard for kindly making available a full transcript of his speech, as well as the slideshow to accompany it.

Can We Trust Transport Modelling?

Are you intending to comment on East Sussex County Council’s Local Transport Plan 4 ( LTP4). For those who want to review the proposals the future projections for transport look good. Predicted to have fewer car trips whilst buses, pedestrians and cycling numbers are all up. That is  good news! …. but as a reminder LTP3 had similar aspirations

Perhaps now is the time to ask why planners are generating such positive scenarios, that you may feel are not achievable. The predictions are derived from complex algorithms. Often the process is described as a ‘black box’. The definition of which is ‘a complex system  whose internal workings are hidden or not readily understood’ . That makes anything it produces as hard to verify

Let us examine the accuracy of such models. From a lay person’s perspective the optimistic scenarios, over the last 10 years, never seem to have been delivered.

This table below , with 19% fewer cars trips, is from the LTP4. Some scenarios deliver an even larger drop in car trips. [As background, on a number of the workshops it had been asked, if some explanation could be be provided as to how the ‘black box’ generated these outputs]

In sharp contrast, in LTP4 it does admit that, across the county, the number of residents cycling has reduced by around 33% in 5 years. Plus there was a large decrease in bus provision over 20 years and even with an increase in funding, bus passengers are only 90% of pre-Covid numbers.

The largely ‘positive’ models are endemic throughout the planning process. Over the last 10 years many focus on a 10% ‘modal shift’, away from cars, towards buses and cycling. However these predictions then feed into other local plans and permeate through the whole planning process.

As an example ESCC’s ‘Hailsham, Polegate to Eastbourne corridor ‘, from 10 years ago, predicted a 10% reduction in modal share for cars. This scenario is then used by developers, on that key route, to show the extra traffic, from their developments, will be offset by the modal shift this original report had predicted. The example used here is taken from the Transport Assessment for Hindsland in Willingdon. (see Tables 6.2 and 6.3)

Method of Travel – Currently (left) and with planned improvements (right)

Notice that the developers take current traffic data and then adjust to the new modal share. So that cars, including passengers, are down from 80% to 70% and this would suggest traffic levels will be lower. To compensate, for the lower private transport, there is an increase in bus trips from 4% to 9%. That is a 125% increase, alongside  an increase for cycling up 150%. But there has never been a demonstrable increase in either.

This general approach, to overstating modal shift, is also seen in Eastbourne, by developers, on schemes such as the Magistrates Court and TJ Hughes. The positive transport assessments, produced around higher levels of active travel, seem to satisfy both developers and councils. They do not alter the reality.

Now look at Black Robin Farm (SDNP/23/04238/FUL). Aecom ,in their transport review for Eastbourne Borough Council, provided a comprehensive analysis of transport options. Their algorithm produced –

The reality check is that for Eastbourne 5% of trips are by bus  and on the Downs nearer 10%. However there is no explanation as to how 50% Public Transport could ever be achieved. Plus in this scenario cycling at 4% would be an increase from an original estimate of 1,000 to 4,000 trips p.a. Cynics might think the data was to convince South Downs National Park that there would not be a high demand for car parking. Based on the  100,000 visitors predicted p.a.

Many of these models have shown to exaggerate the modal shift away from private cars. To provide reassurance, models need to be validated, to see how accurate they were. The Government’s Transport Analysis Guidance (TAG)  “provides an overview of good practice in planning the evaluation of transport interventions to ensure robust evidence can be collected about the difference that they are making in practice. It is intended to support evaluation planning and stronger business cases for a range of transport interventions in terms of mode, type of intervention” Model guidance from Govt

In summary we are asked to take on trust the ‘black box’ approach, that transport planners are using, when our lived experience would suggest something different. Perhaps now is the time to reassess the accuracy of the predictions. If you have doubts then make this clear in your comments for LTP4 and question them about their methodology

Paul Humphreys EEAN Transport Group

Council Consultation Shortcomings

Introduction

Consultations are considered valuable for getting community and stakeholder perspectives. There is even an expectation, from the Government, that where applicable consultations may take place. However particularly in transport, some councils can use them to block change. In contrast as an alternative other councils, especially during Covid, tried out schemes. Then the public could experience the proposed changes and decide if they like them.

It is becoming increasingly clear that relying on consultations  has limitations. The more council consultations, you are involved in,  the more the failings become apparent. These include :-

Question Bias. Written to deliver the ‘desired outcome’. By writing questions in a particular way the options are limited. Such as the one for local cycling, where there was the choice of nothing or designs that were substandard. Not what the ‘users’ wanted. There is often no easy way to specify  a different or better solution. If you choose ‘nothing’ the funds are then lost.

Limited Representation: Consultations attract those who have strong opinions and miss out the majority. On top of this, certain marginalised communities with limited resources, may not have equal access. Leading to an incomplete understanding of the community’s needs. As an example the bus consultation along Seaside is through one of the most deprived wards in the town and has low car ownership. Should the local residents be given greater weight than those who are more vocal but live elsewhere ?

Tokenism: A recent consultation on the town centre had 64% disagreeing or strongly disagreeing with the proposal. The County Council still proceeded. This leads to frustration and distrust among participants for future consultations.

Lack of Expertise: Public consultations often involve those who may not understand the complexities of planning issues or the regulations . Unfortunately not everything can be simplified.

Manipulation : Consultations can be susceptible to manipulation or bias. Those with greater resources or more power may dominate the outcome, drowning out the opinions of others. Special interest groups can exert undue influence and this is often true on both sides of a debate

Constraints: Consultations can be both time-consuming and resource-intensive, requiring significant effort to organise and manage. This can lead to delays in the planning process and using up valuable funds that could be used to deliver real change . It can also be used as a tool to allow councils not to proceed, which may have been their original preference. This can often be the case with anything that adversely affect car drivers. There is pressure for councils to develop ‘green’ plans that they do not really want. This happened during Covid when the county was funded by the Government to implement temporary solutions. If councils can show that there are negative comments they can drop the scheme and keep the funds.

Resistance to Change: Public consultations may reinforce the ‘status quo’, as many people are resistant to any change. Often only a narrow cross-section of the local demographic tends to engage in council consultations.  Often with a preponderance of older people taking part, whilst the views of young people and students, who are mostly reliant on public transport, are not usually represented well enough. However often controversial schemes are then accepted and most would not want it back the way it was.

Social media – Assuming many residents do not fully understand or even look at the documentation, there is the strong evidence of people being influenced by ‘simple summaries’ on social media. This is an increasing problem. As an example a recent local social media campaign had the suggestion that, in the current bus consultation, all of Seaside would become a bus lane and there would be no parking. This is not even close to reality. However these simple messages can then be the main source of misinformation for people completing the online consultation.

Compromise : There is little scope, for those with different views, to come to some common agreement. Often the consultants will speak to the different sides in isolation. When perhaps, through a wider meeting, a compromise could be achieved.

Summary

Consultations can be used in a number of ways :-

  • genuinely find residents opinions
  • ensure the desired outcome from the council’s perspective
  • allow councils to drop schemes they did not actually want
  • rubber stamp a decision that had already been taken

Paul Humphreys  EEAN Transport Group

New Parking Solutions For Eastbourne

The existing approach to parking is no longer enough

The current uninspiring consultation, on parking in Eastbourne Town centre, shows how nothing radical is being considered. Primarily it  does not help to meet  the Borough Council’s 2030 carbon target.

https://consultation.eastsussex.gov.uk/economy-transport-environment/eastbourne-informal-2022/

Eastbourne

There are a large number of underused car parks in the town. Drivers needs to be encouraged to use them, to free up road space. The obvious way is by differential charging and making it cheaper to park there than in the street.

There will always need to be some parking especially places for the disabled and less mobile. But cars are becoming ever bigger and wider and this is limiting the road space. Deciding that  parking availability is a top priority, makes buses passing cars an issue. It has also stopped any cycle lanes being built in the town centre.

London

Other areas of the country are facing the issue of parking head on. So it is worth looking at other councils to see what could be done. Limits by pollution, size of vehicle and CO2 are all possible. As are the removal of some free and pay parking spaces

Take Newham or Lambeth as examples. The latter is the latest council in London to introduce emissions-based parking fees.

Similar charges are expected elsewhere in England. Though they could be less complex with perhaps 4 or 5 bands. Owners of the most polluting cars can expect to pay more than twice as much as cleaner cars. There are now 26 different charges to park for an hour in Lambeth ( see above). It depends on a car’s tax band as to what you pay. Plus a surcharge is added for diesels. These emissions-based charges were shown to change motorists’ behaviour. A spokesman said: “People make fewer journeys or they choose a cleaner vehicle.”

https://www.lambeth.gov.uk/parking/emission-based-parking-charges/street-parking

So this may encourage families with 2 cars to drive into town in the smaller and greener one. Plus there will need to be more dedicated  spaces allocated to EV charging as well as  giving priority to ‘Car Clubs’

In summary, if we are really going to make a ‘modal shift’ in favour of active travel, we have to re-balance the use of road space, in favour of lower carbon options.

Paul Humphreys – EEAN Transport Group

Should Strategies be Realistic?

How should local government present their plans for a greener future? Is it better for them to be realistic or else have a vision that, with only limited interventions, will not be achieved? Let’s look at transport but the same is applicable for other carbon strategies.

The various local government organisations, adopt different approaches, as to the strategies they produce. Transport for South East in their modelling, do not hide away from scenarios where active travel (buses, pedestrians and cycling) actually declines. Below is a projection for 2050 called ‘Our Route to Growth’. [Note the cycle logo includes pedestrians.] Following their recent consultation, TfSE agreed to slightly modify their Investment Plan. However the point is, their models are indicative of what may happen, and not necessarily what campaigners might like.

The more problematic approach is when local government, include in their plans, what you would like, but there is no past or future evidence that these will happen. As an example, there are repeated references to the reduction of cars in local borough and county plans. This is against the backdrop of East Sussex County Council predicting, in their A22 A2290 review,  an increase in traffic of 15% from now to  2039.

So in the new draft Eastbourne Local Plan, it refers to a 15% reduction in car journeys. This is extremely optimistic. As is elsewhere, a 10% modal shift from 70% trips by car to 60%. This is in the ‘Hailsham Polegate Eastbourne corridor’ and would be offset by a 150% increase in cycling, 125% in bus trips and 60% more walking. Even those who have little experience in transport, will realise, what a colossal task this would be. As background, there has never been a decrease locally in car trips. Plus cycling and bus trips have reduced over the last twenty years.

So what can be done to prevent unrealistic predictions. TfSE have a clear requirement to monitor and evaluate any targets. This could be used elsewhere, to hold any predictions to account, such as large reductions in car journeys.

In summary, campaigners should request that ‘over ambitious claims’, although they may initially be welcome, should have a realistic delivery plan behind them

Paul Humphreys EEAN – Transport Group, Bespoke, Cycle East Sussex

Greenhouse Gas Emissions in Eastbourne drop 8% for 2020

Eastbourne Greenhouse Gas emissions for 2020 continue to decrease, as they have done for the last 15 years. Some of this is down to a 5% trend, year on year, and some of it is Covid. However the question is will it be enough ?

The latest national statistics for 2020 have been published. Everybody expected a big decrease due to the pandemic. However it still looks like at this rate the 2030 target for Eastbourne remains a long way off. An 8% reduction in 2020 is in the right direction but as life goes back to normal, following the pandemic, it will be interesting to see the data for 2021, published in a year’s time.


The Tyndall Centre analysis  believes 8% is not enough and says Eastbourne should  “Initiate an immediate programme of CO2 mitigation to deliver cuts in emissions averaging a minimum of 12.3% per year to deliver a Paris aligned carbon budget.”

Emissions per capita, for Eastbourne, using the Government methodology are 2.5 tonnes per person. This is a narrow scope as  it does not include the wider carbon footprint, such as  the transportation  and manufacture of imported goods.

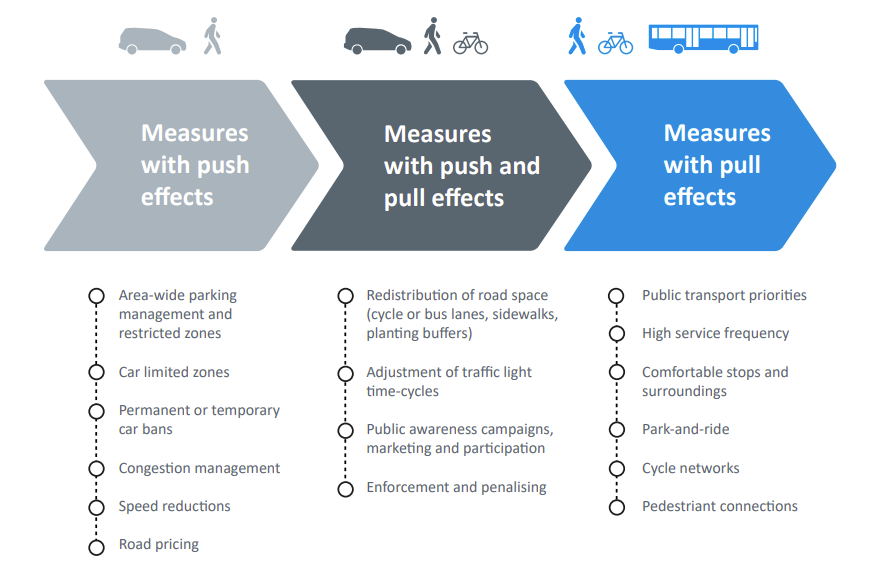
An analysis that includes more is at Carbon Place  ( filter on Eastbourne) where the carbon footprint per person is 6.5 tonnes a person. ( left hand column for Eastbourne right hand is UK average ) Plus there is a useful breakdown of the embodied carbon consumption of each area of Eastbourne. It also reveals the gross inequality of carbon footprints between the richer and poorer parts of the town.

“Nationally transport greenhouse gas emissions saw a decrease of 18% in 2020 compared to 2019. This was largely due to the impact of the COVID-19 pandemic as people stayed at home for large periods of 2020. Despite this large fall, transport remains the sector with the highest greenhouse gas emissions in many local authorities.”

In conclusion the 2030 Eastbourne carbon neutral target seems a long way from being reached. There needs to be a stronger commitment to climate action. This is across the community, with ever deeper collaboration between councillors, council officers, businesses and community groups to ensure that the transition away from dependence upon fossil fuels is as fast as possible

Authors – Paul Humphreys and Andy Durling

Bigger Better Bus and Cycle schemes ?

Eco-Action Transport Group have always said, that to meet the 2030 carbon target, there needs to be a modal shift away from cars and towards bus and cycling. That means re-allocating space, changing priorities and spending money.

However the Government has threatened, that funding for active travel schemes, would only be provided to councils, who have a good track record of delivering. This has the consequence that East Sussex County Council (ESCC) have recently struggled to get funding. One exception is £41M for bus improvements, though the detailed plans will need to be signed off by Department for Transport (DfT).

Recent unsuccessful bids include elements of the “Hailsham to Eastbourne Corridor” along A22/A2270, and pedestrian access in the Eastbourne Town Centre Phase 2A. Likewise the latest Active Travel ‘Covid’ funding allocated ESCC nothing,

For walking and cycling the DfT will only support schemes that comply with design guidance (LTN 1/20). They are not able to support schemes with any of the below elements:-

      • Shared use paths
      • Lack of protection at junctions
      • Cycle tracks in locations where they may not be well-used
      • Poor value for money
      • Not forming part of a coherent wider network

East Sussex County Council have contacted the DfT to discuss their failure to get funds and to get guidance for future bids specifically for cycling and walking schemes.

So what does this mean ? Both East Sussex and Eastbourne Councils believe in consultation and balancing all the various stakeholders. That has meant compromises have had to be made in terms of space allocated to bus and cycle schemes. Campaigners are of the opinion that cycling provision in the town has actually become worse.

If future schemes are to be funded then they need to meet the criteria and as the DfT state ‘Paint on the road is no longer enough‘. The danger is, in order not to upset the car lobby, then nothing will be built. With the projection of 25% more traffic locally by 2039 this can only lead to gridlock at peak times.  Plus an increase in the carbon footprint which  would seriously undermine the delivery of a Carbon Neutral Eastbourne by 2030, as mandated unanimously by all Eastbourne councillors.

Paul Humphreys – Cycle East Sussex


The Eastbourne ECO Action Network in 2021: What was our year like?

As 2021 draws to a close, now is a good time to review the progress of the Eastbourne Eco Action Network.

As 2021 draws to a close, now is a good time to review the progress of the Eastbourne Eco Action Network, which has been very active throughout the year despite all the disruptions caused by the pandemic. Here’s a selection of the highlights as I, Andrew Durling, see them from my perspective as CEO of the Eastbourne Eco Action CIC.

Housing, Energy & Environment

The 2021 Eastbourne Eco Homes webinar was designed and hosted by the Housing and Energy Working Group. Their extensive research helped local residents make their homes much more energy-efficient. 

The Housing & Energy, Research and Transport Groups drafted three Technical Advice Notices (TANs), which were adopted by Eastbourne Borough Council. These rules form a crucial part of the planning guidance for ensuring that developments within Eastbourne are as environmentally sound as possible within current planning law. The TANs cover EV infrastructure, Sustainability in Development, and Biodiversity Net Gain. The Housing & Energy Group have scrutinised the EBC development proposals for the Old Magistrate Court site in Old Orchard Road, and are lobbying for these TANs to be fully incorporated into design schemes. Additionally, the group is actively working with Eastbourne Borough Council and the ECO Action Transport Group to create Low Traffic Neighbourhoods within the town.

The Research Group’s upstream liaison with Eastbourne Borough Council over the Environment Agency’s Pevensey Bay to Eastbourne Coastal Defences Scheme has been a success. Members of the group also collaborate with Ralph Lucas, an Eastbourne resident who is a member of the House of Lords, over biodiversity net gain standards in the Environment Bill and the ecological impacts of Queen’s Green Canopy Project. 

We liaised with councillors and council officers about the development of the Pevensey Bay to Eastbourne Coastal Management Scheme. The Environment Agency has designed the scheme to strengthen the local sea defences so they can cope with the predicted rise in sea levels that climate change will induce by 2100. Without improved sea defences, Eastbourne will become increasingly vulnerable to severe flooding from storm surges.

Sustainability in 2021

The Eastbourne Food Partnership (EFP), some members of which emerged from the EEAN’s Food Working Group and Climate Adaptation Group, became a Community Interest Company in 2021. The change enabled the group to successfully gain its first grant funding to facilitate the development of a sustainable, climate-resilient local food network that can ensure a supply of fresh, healthy, locally produced food distributed equitably to all local residents. 

Furthermore, the EFP is now a member of the national Sustainable Food Places network, and works in close collaboration with 3VA and East Sussex County Council. It has recently been liaising with councillors and council officers about how the Eastbourne Food Partnership, and the EEAN in general, could have some sort of presence within the Food Street project developing in Victoria Place.

Moreover, EEAN wrote vital proposals for ensuring that the Eastbourne Levelling Up Fund (LUF) remains within the purview of the Eastbourne Carbon Neutral 2030 strategy. The Transport Group and CIC submitted a proposal for the delivery of bus priority lanes, to unlock investment in zero carbon buses to reduce pollution supporting modal shift from cars to buses. Given that the LUF aims to increase the number of visitors to Eastbourne by 500,000 per year, a Transport Plan has to be at the heart of the LUF to prevent transport emissions within the town from increasing, and the Transport Working Group has been instrumental in designing that plan throughout 2021.

We have supported the continuing success of Treebourne (which evolved from the Carbon Capture Working Group) and EcoEd2030 (which evolved from the Education Working Group) through administrative support such as draft policy templates, advice on CIC forms, banking services for Treebourne; and an offer of financial grant to help with set up costs. Two CIC directors along with colleagues planted and cared for hundreds of baby trees in the Churchdale Allotment, some 400 of which have been transferred for planting at Tugwell Park.

Social Media & Public Profile in 2021

We have extended our active social media presence with the help of the one paid employee in the EEAN CIC gained under the government’s Kickstart programme. We created a fresh newsletter format using that presence to complete, and publicise, for the first time ever, a detailed survey – prepared by the Kickstart employee with aid from the Transport Working Group – of local people’s opinions about the local bus service, and how it could be improved. This has given a voice to bus users within our community, and we continue to lobby on their behalf. 

Some of the results have been used by East Sussex County Council in compiling its own analysis of local bus services and how to improve them.  This has helped increase our newsletter subscriptions by 47%. This bus survey reached over 12,000 local citizens. Our recent social media posts of Andy Durling’s speech at the COP26 rally in September reached over 6,800 people via organic growth across our social media channels. 

On wider communication, the CIC and other network groups contribute to the Eastbourne Borough Council ECN2030 Newsletter sent to over 10,000 residents; and the CIC and Groups have had articles published in the Eastbourne Herald, stimulating further engagement from the community.

As members of the Eastbourne Cultural Strategy Group and following on from our collaboration with them to facilitate the “Full Frontal” artworks on the empty Debenhams store, we have introduced this group to the possibility of using cultural engagement on the theme of climate change awareness and responses modelled on the excellent work of Creative Carbon Scotland.

We were delighted to work with a local artist and Eastbourne BID in the creation of the ‘You are part of history mural’ located at the junction of York and Grove Road in Eastbourne.

We participated in the march and rally organised by the Eastbourne Climate Coalition on 6 November to coincide with the start of the UN COP26 Climate Summit in Glasgow. I delivered a speech to the rally on behalf of the EEAN, which was later published as a blog on the website. This address had an organic reach in social media of over 6,800, thanks to our Kickstart employee. The EEAN CIC is now collaborating with the Eastbourne Climate Coalition to set up a Climate Hub in Eastbourne.

Eastbourne residents participate in a protest march to recognise COP26

Thank you!

On behalf of all my colleagues in the EEAN CIC, I would like to express my heartfelt thanks and deep gratitude to all the CIC directors, groups and partner organisations within the EEAN for their hard work in the face of the incredible difficulties we’ve all had to deal with in this pandemic year. You are heroes all! I hope you have a very restful and peaceful Christmas and New Year and come back refreshed in 2022 to continue the great work of helping to deal with the greatest challenge of our time: the Climate Emergency.

On a more personal note, I would like to express my heartfelt gratitude and thanks to Miles Berkley, my predecessor as CEO of the EEAN CIC, for his immense contributions to the EEAN and to ecological action generally during his two years in office. His dedication to developing effective collaboration between all partners within the Eastbourne Carbon Neutral 2030 campaign was exceptional and will have a lasting and deep impact.

Happy holidays!

Andrew Durling

Executive Director

20mph speed limit gets trial run on Polegate High Street

East Sussex County Council have consulted the public over plans to make Polegate High Street a 20mph speed limit.

East Sussex County Council have consulted the public over plans to make Polegate High Street a 20mph speed limit, which suggests the Council are using the road as trial to see whether a lower speed limit could make the county’s streets safer and cleaner.

The consultation closed on 26 November. Other suggested improvements for Polegate High Street include better pedestrian access and improved bus stop facilities.

The 20mph speed limit trend

There is a growing trend to make densely populated urban areas more accessible for pedestrians and cyclists. 

The Welsh government already have a head start. In Wales, the current Government is introducing a 20mph speed limit on certain roads across the country.  The change will be trialled in eight communities to gather data about best practice. If the trial is a success, the 20mph speed limit could become the standardised in Wales by 2023.

Why a 20mph speed limit?

The Daily Mail has reported that reducing speed limits from 30 to 20mph can reduce emissions from a typical car by 28%.

Scientists once thought driving at 20mph was less efficient and more polluting than travelling at 30mph.

However, these scientists based their findings on engines ‘cruising’ over a period of time. New research by Skyrad based on ‘stop/start’ traffic tests, suggests that one might find in a town centre that CO2 emissions were 26% lower at 20mph while NOx was 28% lower at 20mph.

This is great news for campaigners who believe urban speed limits keep pedestrians safe and reduce noise pollution.

Speed limits reduce carbon emissions

Skyrad’s graph shows that the mean CO2 produced is a minimum between 15 and 20mph

Researchers tracked the mean CO2 produced at various maximum speed limits for the average family car in an urban area. Finding 20mph was the most viable limit

According to the evidence, if more UK urban areas enforce a 20mph speed limit, carbon emissions will decrease.

Rob King, MBE and founder of ‘20’s Plenty for Us’, praised the research’s findings

He said ‘This research quantifies the effect and shows how reducing maximum speeds can have a significant effect on emissions.’

Speed limits improve air quality 

Skyrad’s second graph shows that a lower speed limit would also improve air quality by reducing the amount of NOx. A combustion engine produces NOx, a harmful pollutant, when it burns fuel.

They also looked at NOx, nitrogen dioxide and monoxide, produced at various speed limits

Speed Limits: The Transport Group view

1] The EEAN transport Group support this project in Polegate and are keen to see other similar projects in the Eastbourne. In response to the consultation, the EEAN Transport Group suggested further improvements to the plan.Install low cost ‘implied’ zebra crossings. These cost less than £1,000 each and do not include a Belisha Beacon, which can take the cost to around £30,000. In Greater Manchester, early trials show that drivers are more likely to give way to pedestrians when an ‘implied’ zebra crossing is in place. The implementation of the ‘implied’ zebra would give more priority to pedestrians, particularly children and older adults. An ‘implied’ zebra crossing would also improve mobility between transport hubs on the High Street.

2] Providing more prominent signage to encourage drivers to turn their engines off while stopped at the Polegate railway crossing.  This would improve air quality for pedestrians and residents. The signage should be extended along the road on both sides of the crossing so that more drivers are aware of the request to turn off their engines. In our experience of walking along the High Street when the crossing is closed, most drivers do not turn off their engines.

David Everson

EEAN Transport Group