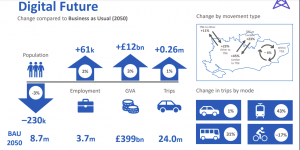
Are you intending to comment on East Sussex County Council’s Local Transport Plan 4 ( LTP4). For those who want to review the proposals the future projections for transport look good. Predicted to have fewer car trips whilst buses, pedestrians and cycling numbers are all up. That is good news! …. but as a reminder LTP3 had similar aspirations
Perhaps now is the time to ask why planners are generating such positive scenarios, that you may feel are not achievable. The predictions are derived from complex algorithms. Often the process is described as a ‘black box’. The definition of which is ‘a complex system whose internal workings are hidden or not readily understood’ . That makes anything it produces as hard to verify
Let us examine the accuracy of such models. From a lay person’s perspective the optimistic scenarios, over the last 10 years, never seem to have been delivered.
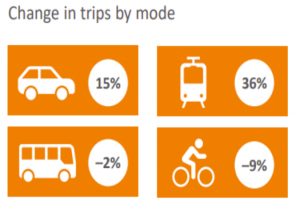
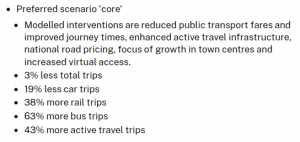
This table below , with 19% fewer cars trips, is from the LTP4. Some scenarios deliver an even larger drop in car trips. [As background, on a number of the workshops it had been asked, if some explanation could be be provided as to how the ‘black box’ generated these outputs]
In sharp contrast, in LTP4 it does admit that, across the county, the number of residents cycling has reduced by around 33% in 5 years. Plus there was a large decrease in bus provision over 20 years and even with an increase in funding, bus passengers are only 90% of pre-Covid numbers.
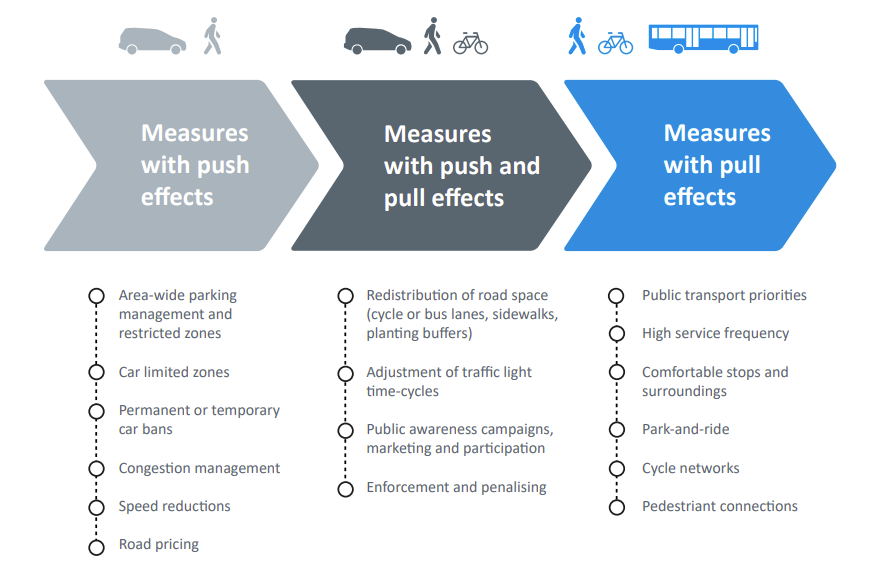
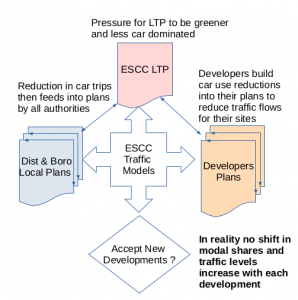
The largely ‘positive’ models are endemic throughout the planning process. Over the last 10 years many focus on a 10% ‘modal shift’, away from cars, towards buses and cycling. However these predictions then feed into other local plans and permeate through the whole planning process.
As an example ESCC’s ‘Hailsham, Polegate to Eastbourne corridor ‘, from 10 years ago, predicted a 10% reduction in modal share for cars. This scenario is then used by developers, on that key route, to show the extra traffic, from their developments, will be offset by the modal shift this original report had predicted. The example used here is taken from the Transport Assessment for Hindsland in Willingdon. (see Tables 6.2 and 6.3)
Method of Travel – Currently (left) and with planned improvements (right)
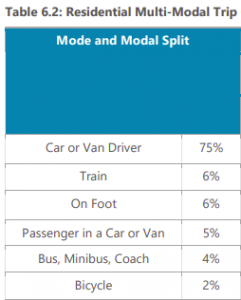
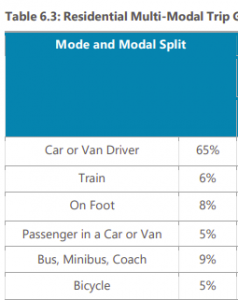
Notice that the developers take current traffic data and then adjust to the new modal share. So that cars, including passengers, are down from 80% to 70% and this would suggest traffic levels will be lower. To compensate, for the lower private transport, there is an increase in bus trips from 4% to 9%. That is a 125% increase, alongside an increase for cycling up 150%. But there has never been a demonstrable increase in either.
This general approach, to overstating modal shift, is also seen in Eastbourne, by developers, on schemes such as the Magistrates Court and TJ Hughes. The positive transport assessments, produced around higher levels of active travel, seem to satisfy both developers and councils. They do not alter the reality.
Now look at Black Robin Farm (SDNP/23/04238/FUL). Aecom ,in their transport review for Eastbourne Borough Council, provided a comprehensive analysis of transport options. Their algorithm produced –
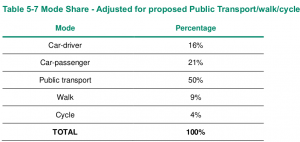
The reality check is that for Eastbourne 5% of trips are by bus and on the Downs nearer 10%. However there is no explanation as to how 50% Public Transport could ever be achieved. Plus in this scenario cycling at 4% would be an increase from an original estimate of 1,000 to 4,000 trips p.a. Cynics might think the data was to convince South Downs National Park that there would not be a high demand for car parking. Based on the 100,000 visitors predicted p.a.
Many of these models have shown to exaggerate the modal shift away from private cars. To provide reassurance, models need to be validated, to see how accurate they were. The Government’s Transport Analysis Guidance (TAG) “provides an overview of good practice in planning the evaluation of transport interventions to ensure robust evidence can be collected about the difference that they are making in practice. It is intended to support evaluation planning and stronger business cases for a range of transport interventions in terms of mode, type of intervention” Model guidance from Govt
In summary we are asked to take on trust the ‘black box’ approach, that transport planners are using, when our lived experience would suggest something different. Perhaps now is the time to reassess the accuracy of the predictions. If you have doubts then make this clear in your comments for LTP4 and question them about their methodology
Paul Humphreys EEAN Transport Group


 Fewer cars will free up space for nature, housing, business and children’s play and reduce congestion. Policy documents have recognised this over 50 years: delivery on the ground is sadly the exception. The new National Planning Policy Framework (NPPF) must deliver such integration if it is to be fit for purpose. Failure to do so would be unfair both to current and future generations.
Based on a letter published Jan 2025 in iNews
Derrick Coffee
Fewer cars will free up space for nature, housing, business and children’s play and reduce congestion. Policy documents have recognised this over 50 years: delivery on the ground is sadly the exception. The new National Planning Policy Framework (NPPF) must deliver such integration if it is to be fit for purpose. Failure to do so would be unfair both to current and future generations.
Based on a letter published Jan 2025 in iNews
Derrick Coffee