A community cargo bike for Eastbourne

A community cargo bike for Eastbourne

By Robert McGowan

After many months of anticipation, we were delighted to receive funding from the Neighbourhood Community Infrastructure Levy (CIL) fund managed by Eastbourne Borough Council to purchase a community cargo bike. Having tested a number of different e-bikes at Get Bikery in Lewes (thanks to Matt Bird and Jamie Lloyd), we decided on a Tern GSD S10.

It felt very stable and simple to ride – equipped with a powerful Bosch electric motor and able to transport plenty in crates attached to the front and rear racks, plus two panniers. With match-funding from EEAN and Eastbourne Food Partnership CICs, we had enough in our budget to order a bright yellow one from elctrc at Brighton Marina.

Brighton yellow electric cargo bike with crates in front and back racks,

Our new Tern GSD S10 loaded and ready to deliver
Photo by Sam Powell

From Brighton Marina to Eastbourne

I collected the Tern one blustery morning – and thoroughly enjoyed putting it through its paces into a strong headwind along the seafront path (yes, there is a seafront cycle path in Brighton, like almost all British seaside towns). Then inland to Falmer and Lewes. Much of the ride was on dedicated cycle paths, separated from the traffic, which was excellent – and the Tern coped superbly on the hills.

Pausing at The Depot in Lewes, I spoke to Matt of Get Bikery about how they are managing their cargo bikes – and was joined by Councillor Andy Collins and EEAN’s Jill Shacklock. The onward ride to Polegate along the A27 shared cycle path was a joy – thanks to the “Turbo” mode. There was sufficient battery power to sail up Cooper’s Hill in Willingdon village, then negotiate the climb past Ocklynge School into Eastbourne’s Old Town.

Jill Shacklock wearing denim jacket and standing behind a yellow electric cargo bike, The bike has racks at the front and back and two black paniers

Jill admires the Tern at The Depot, Lewes

Reducing food waste and carbon emissions

One of our priorities for the cargo bike project will be to support the distribution of food from local growers and community gardens and places with surplus food, such as supermarkets and hospitality outlets to food banks, community larders and kitchens. In all, the plan is to help reduce food waste and reduce food insecurity whilst reducing carbon emissions and air pollution in the local transport system.

Back crate of cargo bike loaded with spinach

Some of the food donated by generous stallholders 
Photo by Sam Powell

From farmer's market to community hub

The Tern’s first task was to transport surplus fruit, vegetables and baked goods from Eastbourne’s new Farmers Market to the Seaside Community Hub – quietly and easily achieved in about 10 minutes. Even with generous food donations from stallholders, a single trip was sufficient. The market takes place on the first Saturday morning of each month in front of Towner Art Gallery, and our cargo bike will be a regular fixture there.

Robert McGowan securing a crate full of spinach onto the back rack of a cargo bike

Robert gets ready to roll
Photo by Sam Powell

Get involved

Do get in touch if you’d be interested in volunteering to ride the Tern on some of these deliveries around town. It’s the first community-owned cargo bike in Eastbourne and hopefully it will inspire others to replace cars and vans for some “last-mile” deliveries – as seen in congested towns and cities across Europe.

Latest posts

Airbourne’s Carbon Footprint 2025

For the first time, Eastbourne Eco Action Network (EEAN) Transport Group has undertaken a survey of the carbon footprint of the audience, going to and from Airbourne, which is also referred to as the Eastbourne Airshow. In the past EEAN have estimated the carbon footprint based on Eastbourne Borough Council (EBC) surveys and from other external sources.

The provisional Carbon Footprint for the Audience, from this survey, is estimated at between *3,500* and *4,000* tonnes CO2e  depending on the assumptions used. Different carbon emission models, the  allocation of a trip within a holiday to Airbourne, vehicle occupancy, multi stage trips, all  affect the data. It should be noted that this range is lower than the estimates, in past years. So a review should be carried out by EEAN, when EBC undertake their own analysis for 2025, to cross check and validate this report

However in undertaking this exercise, there were some shortcomings in the approach, that could be addressed next time. Mainly around more accurately analysing people who are coming to Airbourne from the holiday location and not directly from their home. This is covered in the section “How we should have done the survey” . So a blue print for what we could do in 2026 to improve the research.

Background

EBC’s Events Department state “[We] work pro-actively in our approach to sustainability at all of our events including Airbourne. We strive to ensure that sustainability is at the forefront of our decision making as opposed to being an afterthought. Airbourne brings a significant number of people into our town over the course of four days and we try our best to make our event carbon friendly.”

“Only 3.7% of emissions generated by Airbourne are from the flying display aircraft.  In fact, all of the displays in total generate less than a one-way flight to New York! The biggest generator of all emissions is actually from the people travelling to events, with 96.1% of all emissions at Airbourne 2022 generated by audience related travel, and just 0.2% from other sources.”

From the EBC 2023/24 Carbon neutral report.  “The council has now collected two years’ worth of data from the Airbourne airshow … The visitor survey was particularly successful this year having 1896 responses. As we estimate audience travel based on visitor numbers of 750,000 people, the more people that complete the survey and give us actual information, the more realistic an estimate we can make. Total emissions this year have been calculated as 5479  tonnes, a 12.8% reduction on 2022.”  (Around 96% of this is down to audience travel so this is **5250** tonnes)

Survey Results High level

The largest number of attendees come by car using diesel or petrol, and this is reflected in the charts below . There are a reasonable number of people who use public transport, walk and cycle all of these have lower carbon profiles

Carbon Footprint Assumptions

One problem, for anyone estimating the carbon footprint, is choosing what ‘calculator’ to use . Different organisations vary in their assumptions

Approaches to be considered may include

      • Count all electric vehicles as having zero tailpipe emissions, so no CO2, in line with the the UK emissions by Council 2005 to 2023 , which excludes carbon emissions of any electric transport ( Electric Vehicles, trains, and e-buses ). They also count, over a year, only the distance covered within Eastbourne. So much, of Airbourne’s journeys, will be allocated to the District Councils of Lewes, Wealden and Rother.
      • Including the whole trip ‘door to door’.
      • The whole trip, as in the above, but with all the elements of manufacture, disposal and indirect elements
      • Allocating CO2 for visitors from long distances, who then stay locally. Where they then have short trips to Airbourne where they might cycle or walk, each day, to the event.
      • Regardless the type of car, the larger the vehicle, generally the higher the emissions. Families may choose their largest car for this journey
      • Factoring in ‘Stop start’ journeys, with a different CO2 profile to motorway driving.
      • There are three main types of hybrid: mild , full , and plug-in. Each with a different CO2 profile though here an average of all 3 is used.

Different Calculations for Carbon Emissions

In this report the TNMT approach, is mostly used.

‘Our World in data’ , which is based on UK Government data, tends to be lower. The main difference is around trains where TNMT will include more indirect factors around the infrastructure running a railway.

However at Airbourne, there were higher levels of passengers in buses, trains and cars than for an average journey. This could be reflected in the carbon footprint per passenger. The occupancy rate for cars was just above 3.

There will be trains and buses returning that are not full. Likewise the ‘Park and Ride’ buses were probably running one way with 50 passengers and with very few on the return. Many local buses were so full at times that they drove past waiting passengers

One approach, used in the first iteration of this report, was to calculate the carbon for each vehicle occupant and gross this up for all those involved in the survey. This did not give a significantly different answer than the simpler method of using one person per private vehicle and then adjust later for the sample size.

So, as explained, the TNMT model has additional CO2 for electric vehicles, because of the manufacture and disposal, especially of batteries. Plus the carbon for electricity is very dependent on how green the grid mix is.

Survey analysis

Many people will attend on multiple days and any count is difficult, as there is no controlled access to the event . In the survey, people could describe two methods, they used to get to the event. For the ‘main method’ of transport the estimate for Carbon is 3150 for an assumed audience of 750,000. (There may be in the table some rounding errors).

Total 3,150 Tonnes CO2e

      • Miles 1 way – Reported journey for survey in miles – as this is easier for the public to describe their trip there
      • Km Return for vehicles – Converting into kilometres and then doubling for return
      • Survey Count – Those who describe their ‘Main Method’ for each transport method
      • Passenger Count – The passengers for the ‘Survey Count’
      • CO2 pp gm/km – CO2 per passenger (person) per kilometre (TNMT)
      • CO2 kg pp for all the journeys. Km return * CO2 pp converted into Kilograms
      • CO2 tonne for 750,000 – 750,000 is an estimate used by EBC for attendance ( 372 people in survey * 2000 is approx 750k) Then converted into tonnes
      • Petrol/Diesel – Private Cars with Internal Combustion Engine
      • Other – A mix of methods including powered wheelchairs, motorbikes and larger vehicles
      • Hybrid- An average of different types of hybrid – as not differentiated in survey
      • Taxi – Assumes mostly hybrid cars.

Many people will have multi ‘stage’ trips to get here. Estimates of the ‘second method’ will therefore be for a shorter distance. This will include those visitors who may have come a long way away but are staying reasonably locally and their journeys on these days are less, perhaps using Park and Ride buses, or local buses from the station or town centre. A rough estimate is around 350 tonnes . So the total for all journeys is close to 3,500 Tonnes. ( 3150 + 350)

There is no strong confidence attributable to this figure, as the 750k audience is an estimate and the sample size is small.

Survey questions

Two members of EEAN Transport Group did the interviews. This has the advantage that the interviewer can extract from the conversation the key pieces of data.  They tried to make the sampling as random as possible, by time of day, day of week and location. Having only 128 surveys for 372 people is not enough. The technology was a web-link with 3G on mobile phones to a Google form that feeds a Google Sheet .

Comparison with Eastbourne BC data 2022.

It is assumed that the EBC data is all collected from the online feedback form. It is possible that those strongly motivated or financially affected by the event, will be more likely to complete the survey. So for example the figure of 4 coaches with 180 passengers scaled up to 750,000 people would be a very high 40,000 passengers and 1,000 coach trips. It is assumed that the coach operator completed the survey rather that a random sample of the audience, which would be more in line with the EEAN survey. The coaches appearing to have much higher passenger numbers than those using local buses.

Likewise those who are local and less interested may spend only a few hours but on several days. They may be less likely to fill in the questionnaire. Their day may also include work, leisure and shopping and although perhaps driving to town they walked to Airbourne. The average distances are therefore higher with the EBC ‘model’ than in the EEAN survey.

How we should have done the survey

There were some good elements such as capturing multi stage trips.  For those staying locally the current questionnaire failed to tease out all the complexities of the trip for each day at Airbourne. The questions would be improved by asking

      • How far did you travel, from home to your holiday destination (Miles)
      • How did you get to your holiday destination
      • How many days are/were you on holiday
      • Of these how many are coming to Airbourne
      • How far did you travel, from where you are staying on holiday, to Eastbourne seafront (Miles)
      • How did you get from where you are staying today

Authors – Paul Humphreys and Derrick Coffee

Eastbourne Eco Action Network 2025 Symposium

Eastbourne Eco Action Network 2025 Symposium

By Sam Powell

Nearly six years since Eastbourne Borough Council (EBC) set its target to become carbon neutral by 2030 and the Eastbourne ECO Action Network (EEAN) was formed, the 2025 Symposium offered a moment to reflect on progress, reassess goals, and explore the next steps.

Members of panel discussion at Eastbourne's 2025 Symposium. Members from left to right are Candy Vaughan, Mayor, Oliver Sterno, Plastic Free Eastbourne, Professor Scarlett McNally, Orthopaedic surgeon, Andy Durling, Director Eastbourne Eco Action Network, Stephen, Emmanuel Church, Richard Watson, Energise South Coast, Lord Ralph Lucas

Symposium Panel Discussion


Collaborative dialogue on climate action

Eight presentations, followed by a panel Q&A and open discussion, brought together EEAN members, local councillors, Donnalyn Morris (Bus Service Improvement Plan Officer at East Sussex County Council (ESCC)), representatives from organisations registered as Community Interest Companies and Community Benefit Societies, businesses, charities, campaigners, and residents, including Lord Ralph Lucas.

Participants included representatives from Energise Sussex Coast (ESC), Plastic Free Eastbourne, Bespoke Cycle Group, the Eastbourne United Nations Association (EUNA), the Eastbourne Climate Coalition, international groups such as Friends of the Earth and Greenpeace, and Emmanuel Church, the venue host.

The afternoon began with two opening speeches, one from EEAN’s Executive Director, Andrew Durling and another from EBC Leader Councillor Stephen Holt. Cllr Holt’s speech recognised the achievements of EEAN and associated groups since 2019. He praised EEAN’s role as a “critical friend” to EBC, challenging but constructive, providing a dialogue for improvement toward the 2030 carbon-neutral goal.

Andy outlined how carbon cycles  are essential to life on Earth and stressed the urgent need to restore balance by cutting emissions and enhancing natural carbon capture. We need actions like tree planting and soil restoration to increase the ability of the land and ocean to absorb the excess carbon and neutralise the excess of carbon emitted.

He also highlighted the success of local initiatives, from Treebourne and food allotments, attempting to relocalise the food system and EUNA’s carbon offsetting project,  to hospital car park solar panels, Energise Sussex Coast, and many other environmental projects across the town. 

Andy Durling, presenting

Andy Durling

Community energy, retrofits, fuel vouchers and beyond

Richard Watson, co-founder of ESC, gave a compelling presentation on their community-owned solar projects, including new schemes to install shared solar in blocks of flats using Solshare technology, allowing residents to equitably share the solar energy supplied.

As a Community Benefit Society, ESC secures grants and raises funds through community share offers, so that local energy is owned by local people and supports the local economy through lower costs for residents. Any surplus is used to address fuel poverty, providing practical help with retrofits, Energy Performance Certificate (EPC) improvements, fuel vouchers, retrofit advice and more.

Chris Richards introduced ESC’s Energy Champions project, which trains local volunteers to provide eco-energy advice and connect residents with additional support. He emphasised the importance of understanding Scope 1 (direct), 2 (purchased energy), and 3 (supply chain and other indirect) emissions, and discussed the value of solar carports, ward-specific emissions research, and combining art with climate science to engage the public.

Grid capacity and possibilities

During the panel, Richard highlighted a key barrier: limited local grid capacity. ESC planned a 300kW solar installation at a bowls centre, but they would only use 15%, and the grid cannot handle the reverse flow (when excess solar power is fed back into the grid). A £300,000 upgrade, “for the transformer and the primary substation,” is required, rendering the project unviable. Community batteries, inspired by Australian models, were floated as a potential solution. These store and share power locally.

During the presentation and beyond, there were also suggestions and talks of:

  • AI mapping Eastbourne’s solar potential (rooftops, etc.)
  • Developing solar carports in car parks
  • Exploring the possibility of having community-owned turbines via the Rampion extension – an extension taking place to the pre-existing wind turbines off the coast of Newhaven
  • Solar options for temporary housing (which Cllr Holt was specifically interested in)

“One turbine would generate enough power for 12,000 homes”, Richard said. “So three [large] turbines would be enough to power almost all the homes in Eastbourne.”

Transport and the “modal shift”

Professor Scarlett McNally, orthopaedic surgeon and co-founder of Eastbourne Bespoke Cycle Group, underlined the health and wider environmental, economic and social benefits of active travel. Walking and cycling reduce emissions and improve air quality. But they also reduce the risk of heart disease, diabetes, dementia, cancer, many other illnesses, and road accidents. This also eases pressure on the NHS, both through prevention and reduced accidents.

“142 pedestrians have been hit by cars in Eastbourne over the past five years,” she noted. “This is a health and safety issue, not just a climate one.”

Jill Shacklock, EEAN Director, shared updates from EABUG, a successful project bringing together bus operators, councillors, council officers, and local bus users. She also ran a quiz on emissions and shared key statistics:

  • 68% of Eastbourne commutes are by car; just 2% by bicycle
  • 70% of UK residents support 20mph zones; only 14% oppose
  • Fewer injuries and deaths reported since Wales introduced 20mph limits
  • Community interaction and health improve alongside emissions cuts

Transport featured heavily in the panel Q&A and discussion regarding:

  • The seafront bus lane start date
  • Could sections of the seafront be bus-and-bike only?
  • Possible pedestrianisation areas
  • Funds allocated for bus lanes potentially being redirected elsewhere

Regarding the last point, Cllr Brett Wright said, “We need to put pressure on ESCC to actually spend that money on the bus lanes now, rather than delaying them to free up funds for the Exceat Bridge.”

Professor Scarlett McNally presenting

Professor  Scarlett McNally

Jill Shacklock presenting in front of a slide on campaigning for 20's Plenty

Jill Shacklock

Single-use plastics and consumption

Oliver Sterno of Plastic Free Eastbourne (PFE) outlined how infrastructure changes, like public water fountains and reusable bottle campaigns, can nudge behaviour. Thanks to council support for PFE’s “Refill Eastbourne” project, the town now has 14 public water fountains.

He also shared his annual tracking of travel and consumption reductions, saying, “We need to show people not just how to consume differently, but why.”

On corporate responsibility, he added: “We really need to get some powerful people — like the council, or the government — to start confronting these businesses. It’s the same with the water companies.”

This message of shared responsibility was echoed by the venue hosts, Emmanuel Church. Stephen Brown spoke about energy auditing, water-saving measures, waste reduction, ethical procurement practices and lifestyle changes regarding consumption and carbon footprint reduction. Emmanuel Church won an Eco Church award for environmental sustainability, making it an appropriate venue for the Symposium. The church congregation kindly donated the entire cost of hiring the venue as a gesture of support for the ECN2030 campaign.

Business and carbon offsetting

Ian Elgin of the EUNA spoke on carbon offsetting through the Uganda tree-planting project, which saw 14,000 trees planted in 2023, with similar numbers in 2024. EBC have become involved in the project to offset Airbourne emissions.

During the discussion, he asked: “We’ve got five years to become carbon neutral. Where is the message getting through to businesses?” Christina Ewbank (Eastbourne Chamber of Commerce) offered to connect him with businesses but said manufacturers and parent companies —not just small local branches and businesses—require most encouragement.

Education and youth engagement

A recurring theme throughout the day was how to meaningfully involve young people in climate action. Ideas included:

  • Monthly school eco-magazines
  • Public art campaigns to raise awareness
  • Solar panels on schools
  • Eco projects
  • More influence from Youth Parliament

Treebourne’s school partnerships were praised as models of engagement.

Sea defences

Andrew reminded attendees that the Pevensey Bay to Eastbourne Coastal Management Scheme’s long-term plans won’t start until 2037, and urged faster action alongside others. Whilst Cllr Wright stated that, thinking like a Whitehall civil servant, who decides which towns get sea defence funding, Eastbourne needs to remain economically attractive.

Cllr Jim Murray (Cabinet Member for Carbon Neutral 2030 and Water Champion) noted how the town is prioritised for funding and highlighted its social and economic importance. “If the sea wall collapses, 30,000 houses get flooded. Because of that figure, we’re getting prioritised. We’ve got the largest amount of money singled out for sea defences in the country.”

However, current funding models plan for only 1 metre of rise, while some climate science projections (Professor James Hansen) reach up to 3, 4, even 5 metres, and as Andrew pointed out, £100 million is not enough. He highlighted how Pevensey and Cooden beaches have “extremely low shingle banks” and need to be prioritised by the Environment Agency.

An Eastbourne beach at dusk, tide is out and line of breakwaters runs horizontally across the image,

Council progress

Cllr Murray’s presentation highlighted council progress:

  • 8% reduction in Airbourne emissions (2023 vs 2022) and carbon offsetting through the EUNA Uganda tree scheme
  • EV food waste fleet coming in 2026
  • 480 hectares added to the Seven Sisters ‘Super National Nature Reserve’
  • EV charge points
  • Sustainable new builds and retrofitting
  • Primary and Secondary education, green skills, career engagement

Council emission reductions for 2018/19–2023/24 are as follows:

  • Gas: ↓33% reduction
  • Electricity: ↓49% reduction
  • Fleet fuel: ↓31% reduction

Overall, scope 1 & 2 emissions are down 35.5%. Still, acceleration is needed to meet the 2030 target, as Cllr Murray himself said.

Closing reflections

The day closed with a mix of urgency and hope. “We haven’t solved the problems,” said Lord Ralph Lucas, “but at least we focused on them.”

There are questions left to answer regarding bus and bike lanes, changing transport perspectives, encouraging plastic reduction, ethical consumption, community energy, solar new builds, sea defences, and fundamentally, what stimulates change, and whether/how local economic growth can exist alongside the aims to reduce carbon emissions.

Cllr Candy Vaughan, the town’s Mayor at the time, concluded: “We want to make it happen [carbon neutral by 2030] and it’s only going to be down to us [everyone in the room and Eastbourne] to make anything happen. So let’s start.”

Top 10 actions raised at the 2025 Symposium

  1. Expand community-owned solar and battery storage
  2. Improve cycling, walking and bus infrastructure
  3. Scale up refill schemes and cut plastic waste
  4. Boost carbon literacy and climate education
  5. Accelerate sea defence planning
  6. Engage more businesses in climate responsibility
  7. Continue expanding nature recovery, local food allotments and tree planting
  8. Support green skills and youth employment
  9. Retrofit homes to reduce emissions and fuel poverty
  10. Use arts and media to communicate climate issues

Get Involved

Whether you’re an individual, a business, a school, or a community group, there’s a role for you in helping Eastbourne reach its Carbon Neutral 2030 target.

Ways to get involved:

  • Join or support local projects like Treebourne, Refill Eastbourne, or EABUG
  • Become an ESC Energy Champion and help neighbours cut energy use, adopt greener energy practices and signpost to services
  • Write to your councillor or MP about sea defences, active travel, and climate priorities
  • Follow and engage with EEAN on social media and subscribe for updates
  • See how you can change your household energy system, travel and consumption choices

With five years to go, Eastbourne’s path to carbon neutrality will depend on continued community effort, cross-sector collaboration, and the will to turn plans into progress.

Symposium presentations

Latest posts

Put buses in the fast lane

Put buses in the fast lane

A Smarter Future for Eastbourne

Eastbourne deserves a public transport system that is frequent, punctual, reliable, and affordable. But right now, that’s not the reality. As one of the most congested towns in the Southeast of England, Eastbourne’s traffic is holding back our buses—and our community.

Why Buses Are Struggling

When buses are delayed by traffic, they become unreliable. People then turn to their cars, which adds even more congestion. This vicious cycle makes it harder for bus companies to run profitable routes, leading to service cuts and reduced frequency. And so, the downward spiral continues.

We’ve already seen this happen: routes have been cut, and timetables thinned out. Not because people don’t want to use buses—but because the system isn’t working for them.

Break the Cycle: Prioritise Buses

It’s time to reverse this trend. Bus priority lanes—like those proposed for Seaside–St Anthony’s and Upperton Road—are a key part of the solution. These dedicated lanes would allow buses to bypass traffic, making them faster and more reliable.

With better service, more people will choose the bus. That means:

  • Less congestion
  • Cleaner air
  • More investment in routes
  • A shift toward electric, quieter, and greener buses

Take Action: Support the Bus Lanes

The East Sussex County Council (ESCC) consultation is open until 13th June 2025. This is your chance to support a better future for Eastbourne’s transport.

✅ Support the proposed bus lanes
✅ Break the cycle of congestion and cuts
✅ Help build a cleaner, more connected town

Please see the below links to ESCC’s Citizen Space platform, which provides information, documentation, and the ability to make a representation to the TROs:

East Sussex BSIP – A259 Seaside and St Anthony’s Avenue – Formal TRO Consultation

East Sussex BSIP – A259 Upperton Road/Station Parade, Eastbourne – Formal TRO Consultation


Let’s put buses in the fast lane—and Eastbourne on the right track.

Brighton & Hoe buses route 28 caught in a line of congested traffic

Latest posts

Cheaper ways to travel by bus

Cheaper ways to travel by bus

Making sense of the new fare structures in East Sussex.

The £2 fare cap was introduced in September 2022 to make bus travel more affordable and to encourage more people to travel by bus. It also helped to make bus travel less confusing. Most adult fares were £2 so we knew how much each journey would cost.

The difference between the true fare and the £2 cap was made up from national government funding with money set aside extended to the end of 2024. The fare cap has been successful in bringing more people back to buses, but real and lasting change doesn’t happen overnight and the new government sensibly decided to extend the fare cap into 2025. However, the maximum fare has increased from £2 to £3. Some local authorities and operators have taken this change as an opportunity to review tickets and see whether lower fares can be offered.

Will you pay £1, £2 or £3?

East Sussex County Council have worked with local bus operators to reduce the impact of the higher fare cap using Bus Service Improvement Plan (BSIP) money, which is separate to the national fare cap funding. There are now three single fares for adults, £1, £2 and £3.

On January 1st, some fares went down to £1, some stayed at £2 and some went up to £3. The fare you pay depends on the actual fare set by the bus operator – what you would pay if there wasn’t a national cap.

The table below compares the uncapped fare with what you pay now.

Uncapped fare You Pay
Under £2
£1
£2 – £2.99
£2
£3 or more
£3

As we have got so used to paying £2 fares, it’s hard to know what the fares for trips would be without the cap.

The safest way to find out what your bus journey will cost before you travel, is to check the bus operator web pages or use their apps (see links to bus operators below.)

At the time of writing, the same journey can have different costs with different bus operators. For example, a journey from Willingdon Church Street to Polegate currently costs £2 on Stagecoach buses and £3 on Brighton & Hove buses. The good news from the East Sussex BSIP team is that bus operators are currently reviewing some of their fares and adjusting them to make them more consistent. Watch this space.

Children’s fares are not capped in East Sussex, but they start from 50p.

Read on to find out about ways to travel for less.

stickman style cartoon of man sitting on a bench at a bus stop looking confused

Find the deal for you ...

Are you travelling with children?

Adult fare payers or concessionary pass holders can bring up to four children under the age of 19, for 50 pence each. You must travel with all of the children for their whole journey.

For children travelling without an adult, see  ‘Are you under 19?’ below.

stickman style drawing of woman and three children waiting a a bus stop. the children all have 50p written on their t-shirts

Are you catching more than one bus?

Remember, the fare cap applies to a single bus journey. If your journey involves catching two buses, the total price could be anything between £2 and £6 each way. Better deals are available and we’ve highlighted some of the best deals below.

Return fares

Stagecoach no longer offer return tickets, but check what the return fare is with Brighton & Hove Buses, Compass or Cuckmere as this may save you money.

Day Rider ticket

If your journey involves more than one bus, then an East Sussex Day Rider ticket may be your best option. Bus operators offer their own day rider ticket for use on their buses only. You can also buy the East Sussex multi-operator Day Rider ticket for use on: Stagecoach, Brighton & Hove Buses, Metrobus, Compass, Cuckmere, Big Lemon and Wealden Community Transport services within East Sussex.

A multi-operator day ticket will cost you:

  • £3.75 if you are under 19
  • £4.75 if you are 19-29
  • £6.10 if you are 30 or over

You can buy an East Sussex multi-operator ticket from the bus operators: either use the app or buy from the driver on the bus. If you are buying from the driver, be very clear you want a multi-operator ticket – they often assume you want one just for their services.

You can use multi-operator tickets on bus services within the East Sussex County Council area. Note that this area does not include Brighton & Hove, but if your trip starts or ends in East Sussex, you can use your Day Rider ticket. For example, if you travel from Eastbourne to Brighton on the 12, or 28 bus, you can use your ticket. If you make a trip that starts in Brighton and ends in Brighton, you cannot use your ticket. Similarly, you can travel from Eastbourne to Tunbridge Wells in Kent and back again on Stagecoach bus 51, using a multi-operator ticket, but you cannot use an East Sussex ticket on a journey that starts and ends in Kent. 

If you are under 30 and want to buy a  discounted ticket, you can use the ESCC Age Verification app. 3-ID cards can also be used as proof of age, along with official documents such as a passport or driving license, but you may not want to carry these official documents around with you.

line drawing of two buses next to each other

Are you under 19? (deals for school age children)

 These fares are for unaccompanied children:
  • The East Sussex weekly Freedom Pass for under 19s is still £15. With this bus pass, you can have unlimited travel (on as many bus services as you like with as many operators as you like) on any bus in the East Sussex area for seven days in a row, at all times and days of the year. (This price may be changed at end of July 2025.) The Freedom Pass is a paper ticket which you must buy on the bus. Use the ESCC Age Verification app to prove your age.
  • Off-peak travel (after 6pm on school days and anytime on weekends, bank holidays and school holidays) Unaccompanied children (under 19s) pay £1 for a single fare during off-peak hours.
  • If you travel to and from school within the Eastbourne and Hailsham travel zone (see below), Stagecoach offer a 7 day ‘Eastbourne child weekly ticket’ for £13.50. This is a paper ticket sold on the bus. It is not available from their app. To buy this ticket you will need to be in school uniform, or carry a valid 3iD card. See  Stagecoach information on fare deals for travelling to school, (also covers the annual Student Rider bus pass). 
stickman drawing of three children waiting at a bus stop

If you don’t travel every day

Stagecoach Flexi tickets with Stagecoach app

Flexi tickets are designed for people who have different travel patterns, for example hybrid workers who don’t have to travel to work every day. You can buy

  • Flexi5 – 5 Day Rider tickets for the price of 4, or
  • Flexi10 – 10 Day Rider tickets for the price of 7

Flexi tickets allow you to travel any time of day within specific zones. You can choose which days you want to travel on, as long as you use all tickets within 12 months of purchasing them.
You can buy Flexi tickets for the Eastbourne network zone, or for the Southeast network.

The Eastbourne network zone covers Eastbourne, Willingdon, Polegate, Hailsham, Upper Horsebridge, Roebuck Park, Stone Cross, Pevensey, Westham and everything in between.

The Southeast network zone covers bus services across Kent and East Sussex. (for example Canterbury, Ashford, Ramsgate, Margate, Folkestone, Dover, New Romney, Lydd, Rye, Tenterden, Northiam, Hawkhurst, Hastings, Bexhill-on-Sea, Pevensey, and Eastbourne network.)
You need a mobile phone and the Stagecoach app to buy and use Flexi tickets.

See also Stagecoach MegaRider 7 day and 30 day tickets.

advert for a stagecoach shows hand holding mobile with a flexi5 ticket on screen. Above the phone are the words 'Flexi5 - a bus ticket designed for flexible and part-time workers. Flexi5 - 5 DayRider tickets for the price of 4. Use them anytime in the same year.'
Eastbourne Area Bus Zone - click on the image to go to original document.

Going out for the evening? (from 6pm)

With the Stagecoach South East EveningRider you can have unlimited travel for one evening on all Stagecoach buses in the South East region until 04:00 the following day – adult fare £4.50

EveningRider group fares

The Stagecoach South East Group EveningRider is a new offer for up to five people travelling together in the evening. Five adults can travel together for one evening for £10.

Other group tickets from Stagecoach include East Sussex Group Day Rider, South East Group DayRider – see Stagecoach Group tickets

Latest posts

Bus Into The Future !

New (almost!) double decker buses have appeared on the Stagecoach Eastbourne route 1A in recent weeks, featuring audio announcements of next stops. This is very important for anyone with sight impairment, but reassuring for everyone on the bus – especially those new to bus travel or unfamiliar with the area. In due course, all buses will be required to install this facility giving us a ’step change’ in the quality of bus travel. The display on the front of these buses is in clear ‘white on black’ type, a departure from the current coloured type. Seating is comfortable and charging points standard.

New Improvements

ESCC EVENT- DISPLAYS ON SHOW:
Other improvements are to follow in due course including those unveiled at County Hall in mid-January. An invited audience of groups and individuals saw examples of bus stop information displays designed to help those with sight impairment, while benefiting all users. A large number of bus stops in East Sussex, Brighton and Hove (220) will see these installed, including an audio version with instructions in braille.

Maintaining and Improving Reliability of our Buses

Services restored and increased though the Bus Service Improvement Plan (BSIP) over the last year have added journey opportunities and attracted new passengers. Their voices are now heard through bus user groups set up in Eastbourne and Hastings areas where concerns are aired and opportunities for improvements discussed with local authorities and bus operators. Improvements there certainly have been and more are in the pipeline with bus priority measures coming for Eastbourne to benefit bus services on the Hailsham – Stone Cross – North Langney – Seaside corridor as well as the Hailsham – Polegate – Willingdon – DGH – Eastbourne corridor. These are congestion busters!
BRIGHTON. AND HOVE ‘COASTER’ SERVICE 12 PASSING EXCEAT - SEVEN SISTERS COUNTRY PARK
BRIGHTON. AND HOVE ‘COASTER’ SERVICE 12 PASSING EXCEAT – SEVEN SISTERS COUNTRY PARK
To the west, the success of the popular Brighton and Hove 12/12X13X routes is worthy of note. The proposals between Eastbourne and Brighton are key to its continuing success and development against a backdrop of congestion hotspots, so we strongly support those measures proposed for: A259 Upperton Road – Station Parade, Eastbourne; A259 Newhaven, The Drove – Denton Roundabout; A259 Telscombe Cliffs – Peacehaven.

Conclusion

Buses are certainly getting better: wi-fi is now standard along with the ‘kneeling’ function to allow easy access for all. Derrick Coffee EEAN Transport Group

Latest posts

Franchising or Enhanced Partnerships?

Deregulation

By the 1980’s bus services in England were in decline, with rising costs, increasing subsidies and so in order to address this problem the government of the time decided to deregulate bus services. This meant that private bus operators were allowed to set up bus routes, timetables, services and fares. This process was not a disaster, but the ever-increasing popularity of the private car weakened the need for buses. What we have now is a patchwork of bus operators who prioritised the most profitable routes at the cost of reducing services on less attractive routes such as those in rural areas. Bus companies do not have to make all their bus routes profitable and to their credit they do run some routes at a loss paid for by more profitable routes. Currently most bus routes in the Eastbourne and South Wealden area are operated by Stagecoach but East Sussex County Council (ESCC) subsidise some non-commercial bus routes mainly in rural areas, additionally ESCC also operate the free bus pass scheme for older people.

Bus Back Better

Buses are the most important form of public transport in England accounting for 53% of public transport journeys. But the number of bus users and bus miles is falling. In 2023 bus passenger numbers fell to 3.4 billion from 4.6 billion in 2009. In March 2021 the Department for Transport announced their plans to improve bus services in England via ‘Bus Back Better’. This resulted in roll out of Bus Service Improvement Plans including Enhanced Partnerships (EP) and franchising options, but very few bus franchising schemes have been introduced.

What is an Enhanced Partnership (EP)?

An EP is a model through which the local transport authority and bus operators jointly agree a plan to improve bus services. The plan is a voluntary arrangement and attracts funding from government. East Sussex County Council currently operate an EP with declared aims such as: • Improving fares and ticketing • Improving bus infrastructure • Introducing bus priority measures • Reduce harmful emissions • Improve digital accessibility • Improve public transport information
Inside of Bus
Inside of Bus

What is Franchising?

Franchising is a model of providing bus services where Local Transport Authorities (LTAs) such as county councils take control of how buses are run, this could be on a specific route or a particular area and ask bus operators to bid to operate these routes. The LTA would specify the route, frequency of service, timetable and fares. The current government is keen to further improve bus services and so is encouraging LTA’s to introduce franchising schemes. Franchising is not a new idea and is the model currently used in London, the Channel Islands and in many regions and cities in Europe. Greater Manchester has, this month, just finalised the third tranche of their franchise network and Liverpool are well underway in their planning.

Why we need good bus services?

Bus Stop
Bus Stop
• There are many people in society that do not have the luxury of having their own car or motorcycle and to them good bus services are vital. • There are those that are unable to drive or are too young to drive, they too need good bus services. • Buses connect our communities and allow access for many to health, leisure and education services. • Good bus services can also get people out of their cars and so free up road space which will assist in making buses more reliable. • Using buses will help us reach our carbon reduction targets. • Less traffic on our roads will lead to less pollution. • If bus services become more profitable through greater passenger numbers, then funding can be invested in electric buses. Cambridge and Peterborough consultation document

Some thoughts:

• Analysis seems to show that franchising brings more benefits. • Enhanced partnerships will mean less financial risk to transport authorities. • In a shrinking economy can we afford to place a greater financial burden on local authorities? • The main opposition to bus services is the private car, which is just too convenient, this will not change without a huge shift in public values which is not going to happen soon, if at all. • Do local transport authorities have the expertise to operate bus ticket strategies, bus fare policy, network design, bus timetables etc? • The setting up of a franchise scheme would have very large set up costs. • Perhaps a compromise position could be reached whereby some areas have a franchise scheme while neighbouring areas have an Enhanced Partnership? • Most franchising schemes that are currently in place or are being planned are in locations with high population densities such as Manchester and Liverpool. East Sussex is very much a rural area and hence will be more costly to operate a bus service.

Unitary Authorities

In January 2025 East Sussex County Council applied with West Sussex County Council and Brighton City Council to become a Mayoral Strategic Authority. It is reported that this could unlock significant power and resources to these areas. Transport could be one area to benefit if more funding becomes available as the authority could potentially introduce franchising schemes.

Conclusion 

At the end of the day either the Franchise or the current Enhanced Partnership model will improve bus services in the area. David Everson Eastbourne ECO Action Network Jan 2025

Latest posts

Transport/ Planning Integration

Transport and Planning integration is the key to a sustainable, healthy future. In the big battle against climate change, the one missing yet key weapon in the armoury, accepted by all policy makers for decades but infuriatingly absent in practice, is the full integration of ’transport’ and ‘planning’. We must abandon ‘silo thinking’ around ‘transport’ and ‘planning’. They should be integrated to avoid the procession of car based developments being delivered across the UK. Until that happens, we won’t increase the take-up of shared transport (bus/train/tram) and increase levels of walking and cycling necessary to meet targets. At the same time it will improve the nation’s physical and mental health. Fewer cars will free up space for nature, housing, business and children’s play and reduce congestion. Policy documents have recognised this over 50 years: delivery on the ground is sadly the exception. The new National Planning Policy Framework (NPPF) must deliver such integration if it is to be fit for purpose. Failure to do so would be unfair both to current and future generations. Based on a letter published Jan 2025  in iNews   Derrick Coffee

Latest posts

20 MPH Reducing Injuries

What would make the biggest difference to reducing the ‘Killed and Seriously Injured’ (KSIs) on the roads in East Sussex ? The answer looks like 20mph. This has been shown to be true in Europe and the UK. So why is East Sussex failing to understand this and will the May 2025 County elections make a difference to the approach?

ESCC Current Policy

One of the ongoing issues within East Sussex County Council (ESCC) is their determination to stick to their current policy PS05/02 towards  20 mph zones and limits. There have been numerous motions, from opposition councillors, to change their approach but all have failed. This has also meant that in the latest list of planned improvements there are none around 20mph.

Elsewhere in UK

So what would a lower limit of 20 mph do? Remembering that most higher speed limits, such as 40, 50 and 70 mph would stay the same.

Similar reductions have been seen in parts of Scotland and councils such as Oxford.  It would appear that across the UK nothing has made as much of a difference to reducing KSI figures as 20mph .

One of the concerns is that drivers will not accept the 20mph. However research from DfT shows poor compliance at higher speeds. Plus having some vehicles been driven at 20mph may well affect the behaviour of others


Even if the number of incidents stayed the same the severity of injury is less, if the speed limit is reduced.

ESCC overall approach

So now it is  worth examining neighbours, where East Sussex is  worse than equivalent councils

Source West Sussex

So one view, might be that ESCC are trapped by their own bureaucracy, in reducing all their interventions to very small scale schemes. This does not have a major effect on the overall KSIs and keeps East Sussex at 150% (See above) of the  England KSI average per mile. Currently large sums are spent on consultation, Traffic regulation orders, match funding, sifting, rejecting, reviews and very little on delivery and construction. This is not the most cost-effective option.

The main arguments put forward by ESCC are:-

    • 20 mph limits only reduce speeds by 1 or 2 mph
    • There will be a greater burden of the Police
    • The ESCC targeted approach is better
    • To be effective, speed limits need to be set at a level which appears reasonable to a driver
    • They do not have sufficient funds to meet all the 20mph requests.

Item 4. Above should be re-worded to read, ‘where it is reasonable to a pedestrian’, who is after all the most vulnerable road user.

For more background  it is worth reading the full ESCC Scrutiny Review of 20mph You can follow their logic. But the key question is, ‘Has their existing policy made a difference?’  Yes, perhaps safety is increased in very small, selected areas but overall on a county wide basis the numbers are still poor when compared to other counties.

RoSPA

Now let us look at the evidence of how 20 mph limits and zones do make a significant difference. This is an excellent review by the Royal Society of Prevention of Accidents and gives a good analysis of where they have been implemented.

20 mph limits have been shown to reduce traffic speed, although not as much as 20mph zones with traffic calming. However, they are considerably less expensive to implement, which means that wider areas can be covered. They also provide additional benefits, such as encouraging more physical activity, such as walking and cycling. They can also greatly improve the character of a residential area and quality of life of the residents. 20mph limits are most appropriate for roads where average speeds are already low… and use of the road also gives the clear impression that a 20mph speed or below is the most appropriate.

RoSPA’s guide to 20 mph

Local Transport Plan

So is there hope for the future in the Local Transport Plan 4 (LTP4)? Covering up to 2050. The answer is not encouraging, with ESCC sticking to the same mantras:
The delivery of lower speed limits including 20mph speed limits and zones in the County is done in accordance with East Sussex County Council adopted Policy PS05/02. This policy reflects national guidance and best practice for setting speed limits.”and “The LTP4 policies clearly highlighted that the adopted ESCC Policy PS05/02 is the determinant for setting lower speed limits in the county”

Other links

For further reading There is plenty of evidence and examples at

20splenty.org

Wales and default 20mph

Conclusion

• East Sussex has a much higher than average number of KSIs
• The current approach of small piecemeal interventions, of all  types of schemes,  is not making enough difference to overall road safety. Spending large amounts resisting and rejecting schemes rather than implementing.
• Higher speed limits do not make for good ‘placemaking’, a requirement of LTP4

It is hoped that the May 2025 Council elections will change the balance of power and result in a different direction.

Paul Humphreys – EEAN Transport Group

Bus lane in Eastbourne gets a step closer to reality

Eastbourne Eco Action Network (EEAN) welcomes the decision to approve the new bus lanes. The East Sussex County Council (ESCC) Lead Member for Transport and Environment now supports the revised plans for bus priority measures along Seaside and St Anthony’s Avenue. This being part of the county council’s Bus Service Improvement Plan.

The second public consultation showed that the majority (56%) of replies supported the new plans. Following concerns from local residents and businesses, changes have been made to the original proposal with the result that there will be more parking places than originally planned along the route.

The new plans are predicted to have little or no detrimental effect to journey times along the two roads but would reduce bus journey times, greatly improve reliability and make the bus an attractive alternative for short, local and cross-town trips.

Local councils want to support public transport, walking, cycling and wheeling. ESCC have received £41 million from the government to support better bus services. Bus priority is important for Eastbourne to be able to move to a more sustainable transport system in the future. Buses provide transport for all members of the population including the old, young, disabled and those unable to afford cars.

EEAN are confident that the bus priority measures will be successfully introduced and that local businesses will continue to thrive.

https://www.sussexexpress.co.uk/news/opinion/bus-lane-in-eastbourne-gets-a-step-closer-to-reality-4879544

David Everson

Chair EEAN Transport Group

Let’s try and agree on new transport schemes

There has to be a better way to implement new transport schemes, than making two sets of campaigners, fight it out.

Seaside

The contentious Eastbourne Seaside bus lanes, which have now been agreed by East Sussex County Council (ESCC), still have to be redrawn and then go back to the Department for Transport , for a third time, for final sign off. Large amounts of money have already been spent on redesigning, two consultations, micro modelling traffic flows, health and safety and equality assessments . All this while nothing has been built and a year has gone by.

Non Bus Lane Options

However is seems that outside of the formal process it is possible for the various campaigning sides to agree what they think would work.

In terms of the £41M Bus Service Improvement Programme (BSIP) measures this includes:-

A scheme, proposed in the BSIP consultation, of a 100m ‘bus gate’ at then end of Atlantic Drive and the Crumbles, that would join the North and South harbours for buses. Perhaps a modified version of the 5 and 5A could then run along the seafront and through the harbour. This could lead to a faster and more regular service for the new housing developments.

Priority Traffic Lights for buses, where they actively change the lights, to let them through. You can see the idea at Huggetts Lane in Willingdon , where lights miss a phase if nobody wants to turn right or the green light stays longer if more traffic is on one direction. This makes the traffic flow better. Now add in the detection of buses and perhaps have longer, or earlier green phases. Of course the other vehicles on the same carriageway would also benefit. ESCC have £1.5M for 34 locations where there will be priority lights. Let us make the most of these time savings.

These are both examples of widespread support. There is then less likelihood of campaigners disagreeing and more of the tight budget will be spent on actually building schemes.

Cycling

The same idea should also be used for cycle routes, where there is a often a consensus, that off-road routes do not cause issues for motor vehicles. Such successful schemes include Horsey Sewer, Cuckoo Trail and the A27 shared path to Firle. So let us prioritise these where possible, instead of contentious and poorly configured solutions that are ‘shoehorned’ into narrow spaces on roads and footways.

Based on letter in Eastbourne Herald and Sussex Express ( on line)

Paul Humphreys – EEAN Transport Group

New Bus User Group for South Wealden and Eastbourne

Guest Blog by David Everson

The importance of bus services in and around Eastbourne was a major topic at the initial meeting of the Eastbourne Area Bus Users Group (EABUG). This event took place in Eastbourne Town Hall on 16th October 2024. The group is an initiative of the Eastbourne Eco Action Network (EEAN). It aims to provide an interface between bus users, bus companies and local authorities. EABUG plans to meet three times a year.

Prominent among those present were representatives of local bus companies, Stagecoach, Brighton & Hove and Cuckmere buses. Also present were representatives of local disability groups, local and county councillors plus members of the public.

Jill Shacklock and David Everson (EEAN) both highlighted the need for good bus services. This was for those who could not drive or afford to drive, school children, those with disabilities or the elderly. They also emphasised the need to develop good sustainable transport systems.

East Sussex CC

A member of the East Sussex  Bus Team, Donnalyn Morris, gave an update on a variety of infrastructure projects that had been taking place in Eastbourne and Friston. Work on the Hailsham Mobility Hub was yet to start, with discussions currently taking place with Tesco about the project. The consultation about the proposed Bus Priority measures along Seaside and St Anthony’s in Eastbourne had now completed and a decision would be made in November.

Stagecoach

Matthew Arnold, Commercial Director, Stagecoach South East expressed concern over the detrimental effect that congestion had on bus punctuality and highlighted problems in Eastbourne. He described  these as the worst in the south east. He stated that car traffic was up 15% on pre Covid levels whilst bus passenger numbers had only risen to 94% of pre-Covid usage.

In addition, he also stated that buses were hindered by lack of co-ordination in the planning of roadworks. There needed to be more advance information sharing between ESCC and utility companies.

Brighton & Hove

Ben Garcia, from Brighton and Hove Buses, informed the meeting of recent improvements to their bus services. They are now a UK lead when it comes to inclusivity on their buses. They have dementia friendly seating and their drivers are trained to be ‘Dementia Friends’. All their buses are ‘talking buses’.

Cuckmere

Nick Price from Cuckmere Buses informed the meeting that their operation of eight, 16 seater buses were all driven by volunteers and that their new timetables would be published soon.

The main body of the meeting involved presentations, discussions and workshops about ‘Accessible Information’ on buses. New legislation requires most buses to provide information to passengers about the bus number and route and next stop information. Importantly the information must be given both visually and aurally. The new legislation came into force on 1st October 2024 for buses registered after October 2019. Older buses that need to be retrofitted with display boards and sound systems must be accessible by October 2026.

Using Apps

During the meeting there was a short presentation on how to use both Stagecoach and Brighton & Hove Bus Apps. QR codes were also highlighted as a quick means of accessing information at bus stops. A limiting factor for both of these sources of information is the necessity to have a Smart phone to access it.

Next Meeting

The next meeting of EABUG is planned for February 2025.

For further details please visit – Eastbourne ECO Action Network.

https://ecoactioneb.co.uk/about/eastbourne-area-bus-user-group

Email : bususereastbourne@gmail.com

David Everson

(Chair EEAN Transport Group)

Bus Lane Consultation – Seaside and St Anthony’s

Introduction

Guest Blog by David Everson – Chair of the EEAN Transport Group

Information for those wishing to complete the ESCC Bus Priority Measures consultation for Seaside and St Anthony’s, Eastbourne, which closes on 18th August 2024.

The consultation documentation can be found by following the link below.
Bus Priority Consultation

The EEAN Transport Group support the revised proposals for Bus Priority Measures and would encourage as many people as possible to support the plans in a positive way.

As we look to the future, we need to encourage the use of mass transport systems such as buses to reduce congestion on our roads. Bus can be used by most people including the young and old who are not able to drive a car, or other sections of the community who cannot afford to drive.

Key points 

  • The plan to spend £3 million is a significant investment for Eastbourne and will help the town move towards sustainable transport in the long term.
  • The plan will reduce bus journey times through the proposed bus lane area particularly at peak times making bus use a more attractive option for travellers.
  • The introduction of several pedestrian crossings will improve pedestrian safety and assist those who walk to bus stops.
  • The bus lanes will take up some road space and the amount of parking along Seaside will be reduced. However, surveys carried out by ESCC indicate that sufficient parking will remain for both residents and local businesses.
  • Traffic flow through the project area will be eased and so reduce congestion along Seaside and St Anthony’s. This will make buses more reliable.
  • If passenger numbers increase due to the bus priority measures, then bus companies will be more likely to invest in more buses on routes.
  • If buses are not hindered by congestion, then it is much more likely that bus companies will invest in electric buses which will assist in efforts to decarbonise our transport and improve air quality.
  • There is no evidence that the introduction of a bus lane will damage the viability of local businesses, in fact studies have shown that bus lanes can increase footfall for businesses along routes.
  • Eastbourne is one of the most car dependant towns in the South East of England and the provision of bus lanes will encourage people on to the buses.

ecotransportgp@gmail.com
August 2024


Reporting Potholes

Introduction

The number one current issue for politicians, councils and much of the public is potholes. They are an important issue for drivers but also pedestrians and cyclists. They damage vehicles, cause accidents, and lead to expensive repairs . We must work towards creating safer roads and one solution is for residents to contribute to an online database.

Bespoke and Eco Action Eastbourne are experimenting with ‘Stan the App’. It is easy to use and utilises ‘cutting-edge computer vision technology’ to identify road defects, such as potholes, with remarkable accuracy. Just by driving  you help to build a comprehensive database of road defects, enabling the prioritisation of repairs more effectively.

Damage

National Pothole Day revealed 21% of UK cyclists had accidents caused by potholes. This was evident when Bespoke Cycle Group, for their Kidical Mass ride, had to change the route to avoid the worst potholes in town. Many of the faults had been reported to https://live.eastsussexhighways.com/report  but there is no way of knowing when the issue will be resolved and sometimes unclear if someone else has already reported it. Or you could use https://www.fillthathole.org.uk where you can report a range of other issues on roads and cyclepaths. The system will then pass on your report to the relevant council.

With Stan, every pothole ‘reported’  adds to a more detailed picture. The system uses all the reports to show how big the problem is. It empowers residents to become highway surveyors and holds authorities accountable for road repairs.

In neighbouring West Sussex there was a focus on four towns. The worst of them was Worthing, where the comprehensive road map is still shown heavily in ‘red’.

The easiest way to get involved, is simply download the app to your phone and then record a video of your journey. The app will only upload when you use your wifi. A short time later the system , through AI, has worked out the road defects and added them to the UK map. There is an other option of taking photos and this may be more relevant for cyclists. The system knows where you are and once again you just upload when it is convenient.

There are other apps out there, but it will be more effective if everybody uses the same one and Stan is the RAC’s official pothole reporting partner. You can download the application from both App store and Google Play.

Future Action

In a few months time, the idea would be to write a report for councils and politicians to give them the information they need to get crucial repairs done. It may be that East Sussex Highways would then use it as a source of information

If you are interested in getting involved and want further information, videos and case histories go to http://www.stantheapp.com.

Notes

This article was submitted to Eastbourne Herald but here is some further content. If your internet connection is slow uploading content can take time. However with reasonable bandwidth unless you have recorded a long trip it should be okay. Generally video the routes you have not recorded before. Still experimenting if H.264 or H.265 is best for the video.

In photo mode try to include something that would give the pothole a scale . So perhaps a car wheel, kerb or road marking. Otherwise hard for the system to assess the pothole size.

West Sussex

Here is an example from Worthing of what is possible when residents are involved – Red is a serious problem and Green is okay.

Eastbourne

Here is the starting point with only a few people using the app. Note how around the Golf Course is poor and incomplete. However after a few days it  seems to have filled in the whole route so be patient.

Cycling notes

Trying to record video while cycling, even on an MTB with suspension, may have poorer results. It will not record if going too slow and may struggle with media content that shakes. The system also appears to reject many photos even where there are serious potholes. Overall the effectiveness of uploading data from driving seems higher

Paul Humphreys – EEAN Transport, Bespoke Cycle Group, Cycle East Sussex

Commenting on Wealden Local Plan

Introduction

Whether you live in Wealden or on the borders of Eastbourne, Lewes or Rother additional housing growth, in the Wealden area, will affect you. So you should comment on the Draft Local Plan.

“Wealden District Council is preparing a new Local Plan. [it] will be the key planning document for Wealden District. Once adopted, the Local Plan will form part of the Development Plan for the District, replacing all existing local plan policies and will be used to assess and make decisions on planning applications.” There will be 16,000 new houses of which around 8,000 have already been planned for .

It is a challenge to go through all the background documentation. The consultation itself is over 200 pages. So this blog has had to be selective. To begin with here are the top 8 areas in terms of new housing

Most of this will be in South Wealden and especially on the borders of Eastbourne. From this table you can see that much of the local area is already ‘confirmed’. In Willingdon for example all the space is already committed apart from some ‘windfall’. So you may feel it is too late. This is not the case. Within the plan are some policies that have some merit and these should be supported.

Here are some links you will need . The Wealden Local Plan itself including a short video . Then the Consultation Portal – Where you create an account and add comments

Background

The lack of a local plan has made Wealden vulnerable to developers who were likely to win, if they appealed, when their planning submission was rejected. With a plan the council has more control of where housing can go. Without a plan the growth of housing could be higher. If there is a proposed housing development ,that you do not agree with, then you can highlight this in your submission, ideally linking it to the relevant policy.

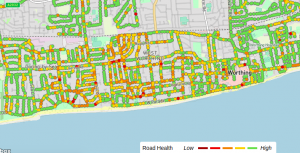
One of the key concerns is the transport infrastructure. Before reading the rest of the blog you may wish to read this blog, on how over optimistic future predictions , are used by councils and developers to the detriment of residents.

Discussions with relevant district officers, councillors and directors suggest there may be residents who do not support a greener and more active travel agenda . Therefore it is important to support these policies and schemes.

Below are a number of the key chapters in the consultation that are worth commenting on. :-

Chapter 3 is Vision and Objectives

Suggest you strongly support “Sustainable and active travel’ but make points as to how this is not being addressed.

There has been no evidence of any increase in public transport, wheeling, cycling and walking. Many County, District and Borough plans refer to a planned shift away from cars . This has never been delivered. In fact East Sussex CC has not achieved any change in the mix of transport and total vehicle trips have simply increased

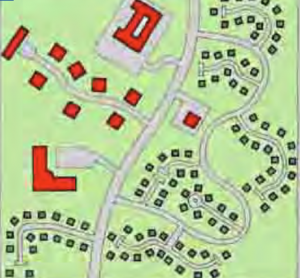
Suggest the need for high level plans across multiple sites. There are many examples where each site has its own access road and no attempt made to have public or active travel routes through these developments . For example at Horsebridge there is an area with over 5 different adjacent estates with no co-ordination of the access across them. A house that you want to visit, maybe only a few hundred meters away, but the car may need to exit one estate and then enter another one. On top of this the connections to the Cuckoo Trail, tell cyclists to dismount and push over 200m on sandy narrow tracks to get to the estates. Discriminatory especially to those who use mobility scooters, elderly or with heavy e-bikes

There needs to be a clear strategy to deal with the effect of all this housing growth on the current residents, where the existing streets might have more ‘permeability’ and could then be used as ‘rat runs’.

Plus stress more emphasis needed on actively supporting greater biodiversity, perhaps in adjacent areas, to counteract the consequences of this extra urban housing. Perhaps though Section 106 agreements.

There does not seem to be enough on encouraging reaching net zero through the design of housing in terms of their location and the wider community. This would strongly support higher insulation, solar panels, EV charging and heat pumps

Chapter 4 – Spatial Strategy

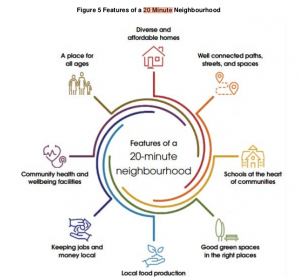
Suggest you strongly support “4.18 The benefits of a 20-minute neighbourhood concept are extensive, providing health, social, environmental and economic benefits to people and communities. Additionally, the concept would seek to tackle many of the issues that we need to address through our plan such as reducing carbon emissions, helping people to become more active, reducing mental health issues and loneliness, improving our town and village centres, making our settlements great places to live as well as improving access to affordable healthy food.

Support the statement in “4.26 East Sussex County Council’s Local Transport Plan 4 Consultation(12) supports the 20-minute neighbourhood or the ‘complete, compact and connected neighbourhood’ approach by providing a shift towards supporting healthy lifestyles by walking, wheeling or cycling and more active travel, as well as through the design of public places and healthy places through integrated neighbourhoods.

So from the above, mention your support for higher density dwellings in the centres which should have access to a mix of leisure, shopping and business all nearby and accessible by bus or active travel. You could also add support for 20 mph and school streets

Support – “Policy SS9: Health, Wellbeing and Quality of Life”that creates improved connectivity and supports healthier and more active lifestyles

Chapter 5 – ‘Climate Change’

Generally strongly support

CC1 Net Zero Development Standards – New Build. Support Policy but would prefer a clearer steer around residential standards of insulation, solar, batteries and heat pumps. There are no examples locally which could be seen as evidence of the ideal higher standards

CC4 Carbon sequestration, Support Policy but make the point, large areas of land are being urbanised and it is unlikely that sequestration could be achieved in or around the new housing estates

Policy CC5: Renewable and Low Carbon Energy. Agree with the principle of “Support will be given to community led energy schemes where evidence of community support can be demonstrated”

Policy CC6 Water Efficiency . Support the principles though make the point it is partly the cumulative effect of all these new houses which will determine how both water and waste (Southern and South East Water) cope. Some of the pumping stations, pipes and sewage works are already under strain

Policy CC7 Managing Flood Risk. Support the principle though areas such as between Polegate and Willingdon have always been susceptible to flooding. Concreting over will add to the problem across all the low lying estates. Make reference to the work the Environment Agency are undertaking around flooding and rising sea level.

Policy CC8 Sustainable Drainage. Support the principle such as in CC7 but perhaps question whether previous experience shows if this been dealt with in the past

Chapter 9 Infrastructure

Policy INF1 Infrastructure provision, delivery, and funding. “The provision of infrastructure facilities such as those relating to healthcare and education should be provided” Stress there needs to be guarantees of them being built and that you have concerns based on recent sites that the delivery of schools and health centres may not happen. This is due to the higher build costs and the funds that health and education may have. Plus a need to adhere to DfT’s “Guidance on Land Use/Transport Interaction Models”

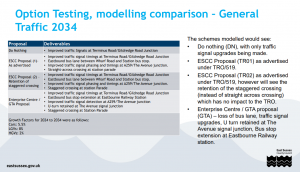
Policy INF2 Sustainable transport and active travel– Support this policy. However the local housing developments simply fail on the criteria listed. No attempt appears to have new been made to create viable routes through multiple estates . Routes identified in the LCWIP, that are supposed to be on these sites ,have not been taken into consideration. Good examples would be alongside the railway from Hampden Park to Polegate (such as routes 312 and 225). Recent experience shows that proposed bus and cycle lanes are very vulnerable to being dropped through pressure from those who do not support them. They must be installed.

Policy INF5 Safeguarding of Infrastructure– Support the concept but as already mentioned there are many potential active travel routes in LCWIP that have been ignored through planning.

Policy INF8 Open space, sports and recreation provision– Suggest make the point – There are large areas of open land that have been lost and this cannot be rectified by a few small parks

Chapter 10 Design

Policy DE1 Achieving well-designed and high-quality places. Support the aim however challenge most of the new developments. These are car centric, low traffic neighbourhoods that do not allow through traffic. Most of the current developments have similar housing and add very few community buildings. The road layouts are meandering and do not support more direct routes for active travel . They also do not support bus routes and this will mean when funding runs out residents without a car will struggle. Perhaps building housing for elderly people should be closer to amenities and bus routes on main roads. In ‘Manual for Streets’ it explains the consequences of building ‘car-centric’ estates that make active travel within the estate and to other destinations problematic

Closing comments.

Please read any other chapters and additional documents, if you want to look into this plan in more detail. You have until Friday 10th May 2024 to submit your comments

Local Transport Plan 4– Guidance Notes

Introduction

Note- Following comments and feedback new sections have been added, at the end, in indigo – 28/01/24

If you are looking to comment on the East Sussex Local Transport Plan (LTP4), you may find this blog helpful. Hopefully it provides some general guidance. Please remember a short blog cannot address all the issues.

Overall the consultation asks you to score a number of nebulous and intangible statements. For most it is hard to disagree with them. You are asked to provide an overall score on categories that are open to interpretation. These might be  for example – strongly agree, agree …..disagree.

However the questions may cover areas where your response might be more nuanced.

As background you may find this blog on the shortcomings of the consultation process of some relevance.

Governance and Reporting

Most project methodologies such as Prince2 have monitoring, interim targets, reports and exception reporting. Most of these are found in the Council’s Carbon Plan .

Section 9. Governance “ Provide oversight of the delivery of the action plan .. Annual reporting to Cabinet and full County on progress “

For transport an equivalent could be modal share. (The split between cars, walking, cycling ,bus and rail). This could be either around private transport (70%) or perhaps for active travel (walking, wheeling, cycling and buses) (20%). Other metrics such as the share of EVs or carbon footprints are perhaps down to national policy.

There were predicted modal share changes, in LTP3,  but there appears to be no review undertaken. It is also normal for plans and projects to have a ‘lesson learnt’ process at the end. So for LTP4 , following the approach elsewhere , there should be:-

•  5 year interim targets. With perhaps one or two clear definable metrics.
•  Review every 2 years
• Description of the new projects for the following 2 years.

This is described in Theme A Section 4.3 “potentially suitable KPIs [ Key Performance Indicators] …. We will establish appropriate governance to oversee the development, delivery and benefits realisation arising from schemes and policies included in this strategy.”

Action – Request that the governance, reporting and targets are more clearly stated

Modal Shares

In the plan there are a number of scenarios provided. All of them are compared to a 2050 ‘Business as Usual’ scenario . This one below is one of the more ‘optimistic’ of them. All have, to some extent, fewer cars trips and more active travel

You may want to consider, as stated in LTP4, that cycle journeys are recently down. Bus journeys are still not at pre-pandemic levels and the plans for bus lanes have been severely scaled back. There has never been any evidence, of a long term reduction, in the modal share and total trips for cars. This is excluding systemic changes resulting from Covid.

The blog on the dangers of unverifiable modelling may be of interest

Action. Ask for more information how the ‘numbers’ behind the scenarios can be validated

Change of Approach by the Council

Campaigners have seen no evidence, of a change in mindset, as suggested by the LTP4 vision. This month the local bus lane plans have been severely reduced, 20 mph schemes are not considered for wide areas, cycle schemes remain very low, but a priority around cars and large road schemes remains in place

Here is an example from Transport Scotland for a clear direction to reduce national car kilometres by 20%.

The route map does not aim to eliminate all car use. We recognise that would not be realistic or fair, especially for journeys undertaken by disabled people or in rural areas where sustainable travel options may not always be available or practical. Rather, the route map encourages all of us to reduce our over reliance on cars wherever possible and identifies four key behaviours that we want everyone in Scotland to consider each time we plan a journey:

• make use of sustainable online options to reduce your need to travel;
• choose local destinations to reduce the distance you travel;
• switch to walking, wheeling, cycling or public transport where possible;
• combine a trip or share a journey to reduce the number of individual car trips you make, if the car remains the only feasible option.

Action – Ask how the council officers and councillors intend to change their approach to transport to support the scenarios they outline in the Plan.

Pollution and Decarbonisation

There are those who think that the issue of carbon can be addressed by a shift to Electric Vehicles (EVs).  Instead of the LTP’s ‘People and Places’ the alternative of ‘Avoid Shift Improve’ is much more focussed on active travel, de-carbonisation and alternatives to the private car, even if electric.

For parking perhaps propose charges based on either CO2 or else around the size of the vehicle. You may also wish to comment on the extra journeys generated through the proposed large road schemes, such as the ‘duelled’ A27.

One aspiration, featured in this and the previous LTP, was linking ‘Land Use Planning’ and Transport. There is very little evidence for recent housing developments that this is being take seriously.

Action – If you want to encourage less polluting vehicles then ask how they will be encouraged ( E-bikes, e-scooters, and smaller greener cars)

Action – Ask for ESCC to be more positive in planning applications in supporting active travel and buses in the large car-centric housing developments especially in South Wealden.

Cycling and Walking

The Plan has many references to more walking, wheeling and cycling. However consider from data provided by ESCC, only £165k has been spent, on cycle infrastructure in the last 4 years.

Contrast this with 6.61 “Reviewing and delivering the Local Cycling and Walking Infrastructure Plan – which includes a robust pipeline of deliverable active travel schemes for networks and places – ensuring a balance of schemes to support walking, wheeling and cycling.

Whatever is written in the LCWIP and in the Council’s budget book, the actual spend on cycling is negligible. The plan ’admits’ that those cycling once a month, in the county, have dropped, in 5 years, from 15% to 10% and is now well below the England average

In terms of walking there has been progress . However  schemes that might help active travel such as 20 mph, Low Traffic Neighbourhoods , modal filters and School Streets require a change in approach from officers and councillors.

Action 1) Ask for evidence of investment, not from the Budget Book, but of actual schemes they will build.

Action 2) In the Health Impact Assessment how the general health of the population will be prioritised . This is around reducing obesity, lack of exercise and multiple chronic conditions

Scenarios

The problem of predicting future levels of traffic, is that even with no interventions, the  so called ‘Business as Usual’ (BAU) in 2050, is different to now. Here is an example from Transport for South East ( TfSE). This is

from their BAU of 2050.  Then the various others scenarios are on top of this. In other words how much the trip balance will change, from BAU, with various interventions. (Note the icon with a cycle is for walking as well)

So the BAU is likely to be similar for East Sussex.  Here are various scenarios from LTP4. Unless one of them is chosen then there is no effective track on progress. This may suit the Council as no real accountability exists. Plus  the option of having 5 year reviews is then less valid. 

Targets

Once an agreed scenario, as above, is agreed there has to be a clear plan to get there. This is called ‘backcasting’ and is the opposite of forecasting. (How do we get there v what might happen). In the image below it shows how it should be broken down into smaller time periods. Perhaps every 5 years.

So in LTP4 there are many schemes and policies but there is no guidance, for readers, as to what would deliver the most change. During the initial workshops there were requests, to provide details as to how the algorithms generated the various scenarios . Otherwise it is a ‘black box’ with outputs that the public have to take on trust. Change would partly be achieved  by the schemes and projects listed in LTP4. (Of course some change will also be through National Government). Otherwise you may mention, in your consultation reply,   certain schemes that sound good to you, but actually  deliver less, in terms of overall change,  than another good alternative. 

The targets could include :-

  • modal shares
  • pollution NOx PMx
  • road traffic incidents
  • children specific  – such as trips to school
  • transport poverty of each council , (that shows Eastbourne to be nearly the worst in the South of England.)

Ideally ones that are already recorded and for which there are comparisons across the UK. 

Cars

If the most important consideration is reducing carbon then moving from the ‘Internal Combustion’ to Electric Vehicles will do this. Especially within the county where the manufacture and disposal is elsewhere as is most of the  electricity production. 

However cars are getting bigger and heavier each year. ( 0.5 cm wider p.a) . They no longer fit in car parking places.  Brakes and tyres create PM2.5 pollution. When in the road they make passing harder and this increases congestion and road damage. Smaller, lighter cars need to be encouraged. Currently an EV charged at home is cheap per mile and this may encourage even more road miles.  If you think road charging might reduce congestion look at this reportAs mentioned earlier ‘Avoid Shift Improve’ would encourage alternatives such as more micro-mobility. 

Paul Humphreys EEAN -Transport Group

Can We Trust Transport Modelling?

Are you intending to comment on East Sussex County Council’s Local Transport Plan 4 ( LTP4). For those who want to review the proposals the future projections for transport look good. Predicted to have fewer car trips whilst buses, pedestrians and cycling numbers are all up. That is  good news! …. but as a reminder LTP3 had similar aspirations

Perhaps now is the time to ask why planners are generating such positive scenarios, that you may feel are not achievable. The predictions are derived from complex algorithms. Often the process is described as a ‘black box’. The definition of which is ‘a complex system  whose internal workings are hidden or not readily understood’ . That makes anything it produces as hard to verify

Let us examine the accuracy of such models. From a lay person’s perspective the optimistic scenarios, over the last 10 years, never seem to have been delivered.

This table below , with 19% fewer cars trips, is from the LTP4. Some scenarios deliver an even larger drop in car trips. [As background, on a number of the workshops it had been asked, if some explanation could be be provided as to how the ‘black box’ generated these outputs]

In sharp contrast, in LTP4 it does admit that, across the county, the number of residents cycling has reduced by around 33% in 5 years. Plus there was a large decrease in bus provision over 20 years and even with an increase in funding, bus passengers are only 90% of pre-Covid numbers.

The largely ‘positive’ models are endemic throughout the planning process. Over the last 10 years many focus on a 10% ‘modal shift’, away from cars, towards buses and cycling. However these predictions then feed into other local plans and permeate through the whole planning process.

As an example ESCC’s ‘Hailsham, Polegate to Eastbourne corridor ‘, from 10 years ago, predicted a 10% reduction in modal share for cars. This scenario is then used by developers, on that key route, to show the extra traffic, from their developments, will be offset by the modal shift this original report had predicted. The example used here is taken from the Transport Assessment for Hindsland in Willingdon. (see Tables 6.2 and 6.3)

Method of Travel – Currently (left) and with planned improvements (right)

Notice that the developers take current traffic data and then adjust to the new modal share. So that cars, including passengers, are down from 80% to 70% and this would suggest traffic levels will be lower. To compensate, for the lower private transport, there is an increase in bus trips from 4% to 9%. That is a 125% increase, alongside  an increase for cycling up 150%. But there has never been a demonstrable increase in either.

This general approach, to overstating modal shift, is also seen in Eastbourne, by developers, on schemes such as the Magistrates Court and TJ Hughes. The positive transport assessments, produced around higher levels of active travel, seem to satisfy both developers and councils. They do not alter the reality.

Now look at Black Robin Farm (SDNP/23/04238/FUL). Aecom ,in their transport review for Eastbourne Borough Council, provided a comprehensive analysis of transport options. Their algorithm produced –

The reality check is that for Eastbourne 5% of trips are by bus  and on the Downs nearer 10%. However there is no explanation as to how 50% Public Transport could ever be achieved. Plus in this scenario cycling at 4% would be an increase from an original estimate of 1,000 to 4,000 trips p.a. Cynics might think the data was to convince South Downs National Park that there would not be a high demand for car parking. Based on the  100,000 visitors predicted p.a.

Many of these models have shown to exaggerate the modal shift away from private cars. To provide reassurance, models need to be validated, to see how accurate they were. The Government’s Transport Analysis Guidance (TAG)  “provides an overview of good practice in planning the evaluation of transport interventions to ensure robust evidence can be collected about the difference that they are making in practice. It is intended to support evaluation planning and stronger business cases for a range of transport interventions in terms of mode, type of intervention” Model guidance from Govt

In summary we are asked to take on trust the ‘black box’ approach, that transport planners are using, when our lived experience would suggest something different. Perhaps now is the time to reassess the accuracy of the predictions. If you have doubts then make this clear in your comments for LTP4 and question them about their methodology

Paul Humphreys EEAN Transport Group

Council Consultation Shortcomings

Introduction

Consultations are considered valuable for getting community and stakeholder perspectives. There is even an expectation, from the Government, that where applicable consultations may take place. However particularly in transport, some councils can use them to block change. In contrast as an alternative other councils, especially during Covid, tried out schemes. Then the public could experience the proposed changes and decide if they like them.

It is becoming increasingly clear that relying on consultations  has limitations. The more council consultations, you are involved in,  the more the failings become apparent. These include :-

Question Bias. Written to deliver the ‘desired outcome’. By writing questions in a particular way the options are limited. Such as the one for local cycling, where there was the choice of nothing or designs that were substandard. Not what the ‘users’ wanted. There is often no easy way to specify  a different or better solution. If you choose ‘nothing’ the funds are then lost.

Limited Representation: Consultations attract those who have strong opinions and miss out the majority. On top of this, certain marginalised communities with limited resources, may not have equal access. Leading to an incomplete understanding of the community’s needs. As an example the bus consultation along Seaside is through one of the most deprived wards in the town and has low car ownership. Should the local residents be given greater weight than those who are more vocal but live elsewhere ?

Tokenism: A recent consultation on the town centre had 64% disagreeing or strongly disagreeing with the proposal. The County Council still proceeded. This leads to frustration and distrust among participants for future consultations.

Lack of Expertise: Public consultations often involve those who may not understand the complexities of planning issues or the regulations . Unfortunately not everything can be simplified.

Manipulation : Consultations can be susceptible to manipulation or bias. Those with greater resources or more power may dominate the outcome, drowning out the opinions of others. Special interest groups can exert undue influence and this is often true on both sides of a debate

Constraints: Consultations can be both time-consuming and resource-intensive, requiring significant effort to organise and manage. This can lead to delays in the planning process and using up valuable funds that could be used to deliver real change . It can also be used as a tool to allow councils not to proceed, which may have been their original preference. This can often be the case with anything that adversely affect car drivers. There is pressure for councils to develop ‘green’ plans that they do not really want. This happened during Covid when the county was funded by the Government to implement temporary solutions. If councils can show that there are negative comments they can drop the scheme and keep the funds.

Resistance to Change: Public consultations may reinforce the ‘status quo’, as many people are resistant to any change. Often only a narrow cross-section of the local demographic tends to engage in council consultations.  Often with a preponderance of older people taking part, whilst the views of young people and students, who are mostly reliant on public transport, are not usually represented well enough. However often controversial schemes are then accepted and most would not want it back the way it was.

Social media – Assuming many residents do not fully understand or even look at the documentation, there is the strong evidence of people being influenced by ‘simple summaries’ on social media. This is an increasing problem. As an example a recent local social media campaign had the suggestion that, in the current bus consultation, all of Seaside would become a bus lane and there would be no parking. This is not even close to reality. However these simple messages can then be the main source of misinformation for people completing the online consultation.

Compromise : There is little scope, for those with different views, to come to some common agreement. Often the consultants will speak to the different sides in isolation. When perhaps, through a wider meeting, a compromise could be achieved.

Summary

Consultations can be used in a number of ways :-

  • genuinely find residents opinions
  • ensure the desired outcome from the council’s perspective
  • allow councils to drop schemes they did not actually want
  • rubber stamp a decision that had already been taken

Paul Humphreys  EEAN Transport Group

New Parking Solutions For Eastbourne

The existing approach to parking is no longer enough

The current uninspiring consultation, on parking in Eastbourne Town centre, shows how nothing radical is being considered. Primarily it  does not help to meet  the Borough Council’s 2030 carbon target.

https://consultation.eastsussex.gov.uk/economy-transport-environment/eastbourne-informal-2022/

Eastbourne

There are a large number of underused car parks in the town. Drivers needs to be encouraged to use them, to free up road space. The obvious way is by differential charging and making it cheaper to park there than in the street.

There will always need to be some parking especially places for the disabled and less mobile. But cars are becoming ever bigger and wider and this is limiting the road space. Deciding that  parking availability is a top priority, makes buses passing cars an issue. It has also stopped any cycle lanes being built in the town centre.

London

Other areas of the country are facing the issue of parking head on. So it is worth looking at other councils to see what could be done. Limits by pollution, size of vehicle and CO2 are all possible. As are the removal of some free and pay parking spaces

Take Newham or Lambeth as examples. The latter is the latest council in London to introduce emissions-based parking fees.

Similar charges are expected elsewhere in England. Though they could be less complex with perhaps 4 or 5 bands. Owners of the most polluting cars can expect to pay more than twice as much as cleaner cars. There are now 26 different charges to park for an hour in Lambeth ( see above). It depends on a car’s tax band as to what you pay. Plus a surcharge is added for diesels. These emissions-based charges were shown to change motorists’ behaviour. A spokesman said: “People make fewer journeys or they choose a cleaner vehicle.”

https://www.lambeth.gov.uk/parking/emission-based-parking-charges/street-parking

So this may encourage families with 2 cars to drive into town in the smaller and greener one. Plus there will need to be more dedicated  spaces allocated to EV charging as well as  giving priority to ‘Car Clubs’

In summary, if we are really going to make a ‘modal shift’ in favour of active travel, we have to re-balance the use of road space, in favour of lower carbon options.

Paul Humphreys – EEAN Transport Group