Airbourne Travel Carbon Footprint 2026

Introduction

Eastbourne Eco Action Network (EEAN) Transport Group in 2026 has once again undertaken a survey of the carbon footprint of the audience, going to and from Airbourne, which is also referred to as the Eastbourne Airshow.

This year more effort was spent on working out the whole travel footprint of visitors who have spent many days in the area and from this data allocating one day’s worth to their trip to Airbourne on top of what they did on the day. There was  also a decision taken  to work out both the direct emissions ( Tank to Wheel) as well as the total lifetime footprint. By doing this the baseline assumptions from our 2025 survey have not been adhered to. Most importantly by capturing more trips and mileage, than before ,the numbers in some scenarios have increased.

So last year I wrote “[Shortcomings were …. Mainly around more accurately analysing people who are coming to Airbourne from the holiday location and not directly from their home….. this is a blue print for what we could do in 2026 to improve the research.

This year’s estimated Carbon footprint for 2026 is **4543**  tonnes of CO2e . However in this report other totals are mentioned

Background

EBC’s Events Department for 2024 stated “[We] work pro-actively in our approach to sustainability at all of our events including Airbourne. We strive to ensure that sustainability is at the forefront of our decision making as opposed to being an afterthought. Airbourne brings a significant number of people into our town over the course of four days and we try our best to make our event carbon friendly.

democracy.lewes-eastbourne.gov.uk/documents/s39059/100+Eastbourne+Carbon+Neutral+2030+Annual+Update+Report.pdf

Where for comparison and context for Airbourne “Greenhouse gas emissions across the Eastbourne borough continue to go down leading to a total of 257,000 tonnes CO2e emitted in 2023”

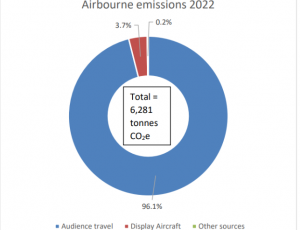
From 2023/24 “Only 3.7% of emissions generated by Airbourne are from the flying display aircraft. In fact, all of the displays in total generate less than a one-way flight to New York! The biggest generator of all emissions is actually from the people travelling to events, with 96.1% of all emissions at Airbourne 2022 generated by audience related travel, and just 0.2% from other sources.”

The 750,000 visitor figure for the Eastbourne Airbourne International Airshow is considered a ‘low-confidence estimate’ because it is an uncounted, un-ticketed free event spanning a massive two-mile open seafront. However if this remains constant it makes year on year comparisons easier. The council relies on small-sample visitor surveys to gauge attendance. For instance, in their carbon neutral reporting, they explicitly state they estimate audience travel metrics based on a fixed boilerplate assumption of 750,000 people. The small sample size issue is even more acute for EEAN where only 140 surveys were undertaken. One or two visitors coming from the other side of the world makes numbers unreliable.

Methodology

This years survey identified those who were on holiday for a number of days and worked out this carbon footprint  and alloacted based on one day, when they are at Airbourne. Then worked out the footprint of the day itself.  So as an example if someone drove on a 300 mile journey to Sussex. Their return journey would be for 600 miles and if they stayed 6 days each day has a 100 mile ‘share’. If they stayed in a local hotel, on the seafront, they might walk there and have a carbon footprint of 0 on the day.

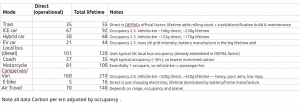
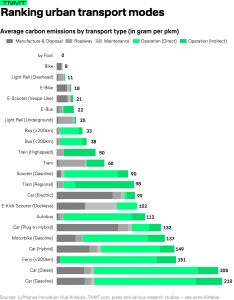
Below are the carbon footprint in gms per passenger per kilometre. However, based on this sample, adjusted for the following occupancy rates. Cars 2.5 , CamperVans 2.0. Others, such as Buses, Coaches and Trains,  using commonly used factors. Direct is the ‘Tank to Wheel’ and excludes power generation and oil refining. Total Lifetime is all of the previous but also manufacture, disposal, spares etc..
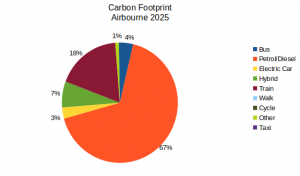
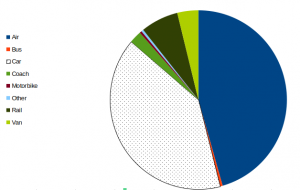
So in the survey sample of 140 this is the carbon footprint by share. This Pie Chart is the split on the day they attended Airbourne. Note the large share for walking. The reasons are local people in town popping in, visitors who drove down but staying with locals, friends, family or in a hotel.
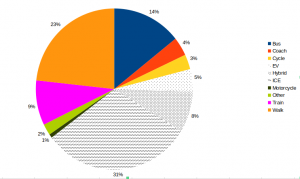
Then the share of carbon for the holiday. Note how the amount for Air is huge. This may be a distortion based on a few very long flights from the other side of the world.
So the calculations can be complex but here are the carbon footprints for all those in the sample using 1 method, in gm CO2e . Then aggregated to Kg and finally to scale up to 750,000 visitors in tonnes CO2e.
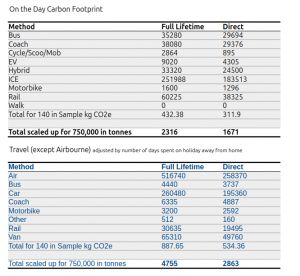
Full Lifetime footprint.

This is not a methodology that the Government would use, where they may show electric trains and electric vehicles with zero footprint. It may be useful to look at the below to see how Full Lifetime can be arrived at. In our sample the total is **7071** tonnes CO2e. However this allocation of huge mileage from long overseas trips to Airbourne may not be ‘fair’. However the total is still of itself interesting.
Paul Humphreys – Main Author

Thanks to other members of EEAN who helped collect the data
Airbourne’s Carbon Footprint 2025

For the first time, Eastbourne Eco Action Network (EEAN) Transport Group has undertaken a survey of the carbon footprint of the audience, going to and from Airbourne, which is also referred to as the Eastbourne Airshow. In the past EEAN have estimated the carbon footprint based on Eastbourne Borough Council (EBC) surveys and from other external sources.

The provisional Carbon Footprint for the Audience, from this survey, is estimated at between *3,500* and *4,000* tonnes CO2e  depending on the assumptions used. Different carbon emission models, the  allocation of a trip within a holiday to Airbourne, vehicle occupancy, multi stage trips, all  affect the data. It should be noted that this range is lower than the estimates, in past years. So a review should be carried out by EEAN, when EBC undertake their own analysis for 2025, to cross check and validate this report

However in undertaking this exercise, there were some shortcomings in the approach, that could be addressed next time. Mainly around more accurately analysing people who are coming to Airbourne from the holiday location and not directly from their home. This is covered in the section “How we should have done the survey” . So a blue print for what we could do in 2026 to improve the research.

Background

EBC’s Events Department state “[We] work pro-actively in our approach to sustainability at all of our events including Airbourne. We strive to ensure that sustainability is at the forefront of our decision making as opposed to being an afterthought. Airbourne brings a significant number of people into our town over the course of four days and we try our best to make our event carbon friendly.”

“Only 3.7% of emissions generated by Airbourne are from the flying display aircraft.  In fact, all of the displays in total generate less than a one-way flight to New York! The biggest generator of all emissions is actually from the people travelling to events, with 96.1% of all emissions at Airbourne 2022 generated by audience related travel, and just 0.2% from other sources.”

From the EBC 2023/24 Carbon neutral report.  “The council has now collected two years’ worth of data from the Airbourne airshow … The visitor survey was particularly successful this year having 1896 responses. As we estimate audience travel based on visitor numbers of 750,000 people, the more people that complete the survey and give us actual information, the more realistic an estimate we can make. Total emissions this year have been calculated as 5479  tonnes, a 12.8% reduction on 2022.”  (Around 96% of this is down to audience travel so this is **5250** tonnes)

Survey Results High level

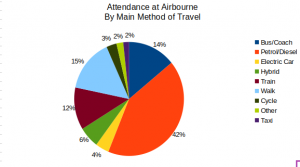
The largest number of attendees come by car using diesel or petrol, and this is reflected in the charts below . There are a reasonable number of people who use public transport, walk and cycle all of these have lower carbon profiles

Carbon Footprint Assumptions

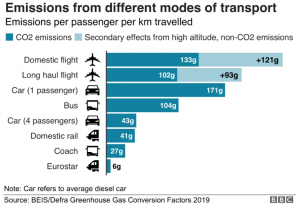
One problem, for anyone estimating the carbon footprint, is choosing what ‘calculator’ to use . Different organisations vary in their assumptions

Approaches to be considered may include

      • Count all electric vehicles as having zero tailpipe emissions, so no CO2, in line with the the UK emissions by Council 2005 to 2023 , which excludes carbon emissions of any electric transport ( Electric Vehicles, trains, and e-buses ). They also count, over a year, only the distance covered within Eastbourne. So much, of Airbourne’s journeys, will be allocated to the District Councils of Lewes, Wealden and Rother.
      • Including the whole trip ‘door to door’.
      • The whole trip, as in the above, but with all the elements of manufacture, disposal and indirect elements
      • Allocating CO2 for visitors from long distances, who then stay locally. Where they then have short trips to Airbourne where they might cycle or walk, each day, to the event.
      • Regardless the type of car, the larger the vehicle, generally the higher the emissions. Families may choose their largest car for this journey
      • Factoring in ‘Stop start’ journeys, with a different CO2 profile to motorway driving.
      • There are three main types of hybrid: mild , full , and plug-in. Each with a different CO2 profile though here an average of all 3 is used.

Different Calculations for Carbon Emissions

In this report the TNMT approach, is mostly used.

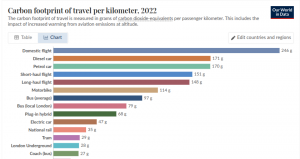
‘Our World in data’ , which is based on UK Government data, tends to be lower. The main difference is around trains where TNMT will include more indirect factors around the infrastructure running a railway.

However at Airbourne, there were higher levels of passengers in buses, trains and cars than for an average journey. This could be reflected in the carbon footprint per passenger. The occupancy rate for cars was just above 3.

There will be trains and buses returning that are not full. Likewise the ‘Park and Ride’ buses were probably running one way with 50 passengers and with very few on the return. Many local buses were so full at times that they drove past waiting passengers

One approach, used in the first iteration of this report, was to calculate the carbon for each vehicle occupant and gross this up for all those involved in the survey. This did not give a significantly different answer than the simpler method of using one person per private vehicle and then adjust later for the sample size.

So, as explained, the TNMT model has additional CO2 for electric vehicles, because of the manufacture and disposal, especially of batteries. Plus the carbon for electricity is very dependent on how green the grid mix is.

Survey analysis

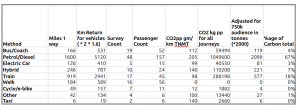
Many people will attend on multiple days and any count is difficult, as there is no controlled access to the event . In the survey, people could describe two methods, they used to get to the event. For the ‘main method’ of transport the estimate for Carbon is 3150 for an assumed audience of 750,000. (There may be in the table some rounding errors).

Total 3,150 Tonnes CO2e

      • Miles 1 way – Reported journey for survey in miles – as this is easier for the public to describe their trip there
      • Km Return for vehicles – Converting into kilometres and then doubling for return
      • Survey Count – Those who describe their ‘Main Method’ for each transport method
      • Passenger Count – The passengers for the ‘Survey Count’
      • CO2 pp gm/km – CO2 per passenger (person) per kilometre (TNMT)
      • CO2 kg pp for all the journeys. Km return * CO2 pp converted into Kilograms
      • CO2 tonne for 750,000 – 750,000 is an estimate used by EBC for attendance ( 372 people in survey * 2000 is approx 750k) Then converted into tonnes
      • Petrol/Diesel – Private Cars with Internal Combustion Engine
      • Other – A mix of methods including powered wheelchairs, motorbikes and larger vehicles
      • Hybrid- An average of different types of hybrid – as not differentiated in survey
      • Taxi – Assumes mostly hybrid cars.

Many people will have multi ‘stage’ trips to get here. Estimates of the ‘second method’ will therefore be for a shorter distance. This will include those visitors who may have come a long way away but are staying reasonably locally and their journeys on these days are less, perhaps using Park and Ride buses, or local buses from the station or town centre. A rough estimate is around 350 tonnes . So the total for all journeys is close to 3,500 Tonnes. ( 3150 + 350)

There is no strong confidence attributable to this figure, as the 750k audience is an estimate and the sample size is small.

Survey questions

Two members of EEAN Transport Group did the interviews. This has the advantage that the interviewer can extract from the conversation the key pieces of data.  They tried to make the sampling as random as possible, by time of day, day of week and location. Having only 128 surveys for 372 people is not enough. The technology was a web-link with 3G on mobile phones to a Google form that feeds a Google Sheet .

Comparison with Eastbourne BC data 2022.

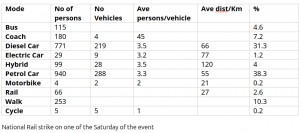
It is assumed that the EBC data is all collected from the online feedback form. It is possible that those strongly motivated or financially affected by the event, will be more likely to complete the survey. So for example the figure of 4 coaches with 180 passengers scaled up to 750,000 people would be a very high 40,000 passengers and 1,000 coach trips. It is assumed that the coach operator completed the survey rather that a random sample of the audience, which would be more in line with the EEAN survey. The coaches appearing to have much higher passenger numbers than those using local buses.

Likewise those who are local and less interested may spend only a few hours but on several days. They may be less likely to fill in the questionnaire. Their day may also include work, leisure and shopping and although perhaps driving to town they walked to Airbourne. The average distances are therefore higher with the EBC ‘model’ than in the EEAN survey.

How we should have done the survey

There were some good elements such as capturing multi stage trips.  For those staying locally the current questionnaire failed to tease out all the complexities of the trip for each day at Airbourne. The questions would be improved by asking

      • How far did you travel, from home to your holiday destination (Miles)
      • How did you get to your holiday destination
      • How many days are/were you on holiday
      • Of these how many are coming to Airbourne
      • How far did you travel, from where you are staying on holiday, to Eastbourne seafront (Miles)
      • How did you get from where you are staying today

Authors – Paul Humphreys and Derrick Coffee

Driving to Airbourne

In Eastbourne Borough Council’s commitment to a carbon neutral 2030 one of the most contentious sources is Airbourne. An issue where some councillors have resigned. However their recently published report, on the event’s 2022 carbon footprint, showed that 96% was down to ‘audience’ travel. Whereas very little was linked to the aircraft

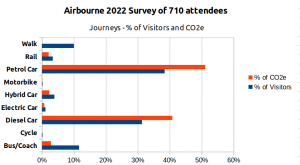
During the event the council undertook a survey of 710 people. They found 74% came by private car. Using Kolin Schunks carbon tool these journeys accounted for 95% of all the ‘travel’ CO2e. This being 91% of the CO2e for everything at Airbourne.

To be fair 2022 was not typical and due to industrial action had less rail travel but the clear message is, even in a ‘normal’ year, most carbon will be down to private car trips.

People might think that with more electric vehicles the carbon footprint will become very much less. However EVs with low mileage have big manufacture and disposal carbon footprints. With a trend for being ever larger and 15% heavier, than the fossil fuel equivalent, they are not the solution for everything and they still take up the same road space

Then with the raw data it was possible to have a ‘rough and ready’ estimate for traffic. Where assuming up to 10km was driven in Eastbourne and within 40km in East Sussex. This showed only 13%, of the total distance driven, is within Eastbourne and a further 21% elsewhere in East Sussex. So most of the event’s CO2e is not directly linked to the Eastbourne area.

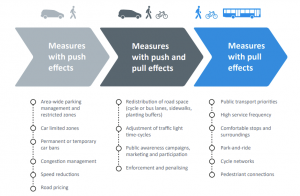
Below are some of the measures that would reduce car trips. Experts suggest it is not enough to only use ‘pull’ measures like cycle and bus lanes. There has to be ‘push’ measures, which are equally important for the rest of the year.

Graphic from TUMI

TUMI

So in conclusion, if Eastbourne wants to reduce the carbon footprint for Airbourne, they need to discourage car trips. They would have to implement measures such as car bans, higher parking charges and tighter parking management. The question is does anyone have the commitment to do this?

Paul Humphreys – Transport Group