Airbourne’s Carbon Footprint 2025

For the first time, Eastbourne Eco Action Network (EEAN) Transport Group has undertaken a survey of the carbon footprint of the audience, going to and from Airbourne, which is also referred to as the Eastbourne Airshow. In the past EEAN have estimated the carbon footprint based on Eastbourne Borough Council (EBC) surveys and from other external sources.

The provisional Carbon Footprint for the Audience, from this survey, is estimated at between *3,500* and *4,000* tonnes CO2e  depending on the assumptions used. Different carbon emission models, the  allocation of a trip within a holiday to Airbourne, vehicle occupancy, multi stage trips, all  affect the data. It should be noted that this range is lower than the estimates, in past years. So a review should be carried out by EEAN, when EBC undertake their own analysis for 2025, to cross check and validate this report

However in undertaking this exercise, there were some shortcomings in the approach, that could be addressed next time. Mainly around more accurately analysing people who are coming to Airbourne from the holiday location and not directly from their home. This is covered in the section “How we should have done the survey” . So a blue print for what we could do in 2026 to improve the research.

Background

EBC’s Events Department state “[We] work pro-actively in our approach to sustainability at all of our events including Airbourne. We strive to ensure that sustainability is at the forefront of our decision making as opposed to being an afterthought. Airbourne brings a significant number of people into our town over the course of four days and we try our best to make our event carbon friendly.”

“Only 3.7% of emissions generated by Airbourne are from the flying display aircraft.  In fact, all of the displays in total generate less than a one-way flight to New York! The biggest generator of all emissions is actually from the people travelling to events, with 96.1% of all emissions at Airbourne 2022 generated by audience related travel, and just 0.2% from other sources.”

From the EBC 2023/24 Carbon neutral report.  “The council has now collected two years’ worth of data from the Airbourne airshow … The visitor survey was particularly successful this year having 1896 responses. As we estimate audience travel based on visitor numbers of 750,000 people, the more people that complete the survey and give us actual information, the more realistic an estimate we can make. Total emissions this year have been calculated as 5479  tonnes, a 12.8% reduction on 2022.”  (Around 96% of this is down to audience travel so this is **5250** tonnes)

Survey Results High level

The largest number of attendees come by car using diesel or petrol, and this is reflected in the charts below . There are a reasonable number of people who use public transport, walk and cycle all of these have lower carbon profiles

Carbon Footprint Assumptions

One problem, for anyone estimating the carbon footprint, is choosing what ‘calculator’ to use . Different organisations vary in their assumptions

Approaches to be considered may include

      • Count all electric vehicles as having zero tailpipe emissions, so no CO2, in line with the the UK emissions by Council 2005 to 2023 , which excludes carbon emissions of any electric transport ( Electric Vehicles, trains, and e-buses ). They also count, over a year, only the distance covered within Eastbourne. So much, of Airbourne’s journeys, will be allocated to the District Councils of Lewes, Wealden and Rother.
      • Including the whole trip ‘door to door’.
      • The whole trip, as in the above, but with all the elements of manufacture, disposal and indirect elements
      • Allocating CO2 for visitors from long distances, who then stay locally. Where they then have short trips to Airbourne where they might cycle or walk, each day, to the event.
      • Regardless the type of car, the larger the vehicle, generally the higher the emissions. Families may choose their largest car for this journey
      • Factoring in ‘Stop start’ journeys, with a different CO2 profile to motorway driving.
      • There are three main types of hybrid: mild , full , and plug-in. Each with a different CO2 profile though here an average of all 3 is used.

Different Calculations for Carbon Emissions

In this report the TNMT approach, is mostly used.

‘Our World in data’ , which is based on UK Government data, tends to be lower. The main difference is around trains where TNMT will include more indirect factors around the infrastructure running a railway.

However at Airbourne, there were higher levels of passengers in buses, trains and cars than for an average journey. This could be reflected in the carbon footprint per passenger. The occupancy rate for cars was just above 3.

There will be trains and buses returning that are not full. Likewise the ‘Park and Ride’ buses were probably running one way with 50 passengers and with very few on the return. Many local buses were so full at times that they drove past waiting passengers

One approach, used in the first iteration of this report, was to calculate the carbon for each vehicle occupant and gross this up for all those involved in the survey. This did not give a significantly different answer than the simpler method of using one person per private vehicle and then adjust later for the sample size.

So, as explained, the TNMT model has additional CO2 for electric vehicles, because of the manufacture and disposal, especially of batteries. Plus the carbon for electricity is very dependent on how green the grid mix is.

Survey analysis

Many people will attend on multiple days and any count is difficult, as there is no controlled access to the event . In the survey, people could describe two methods, they used to get to the event. For the ‘main method’ of transport the estimate for Carbon is 3150 for an assumed audience of 750,000. (There may be in the table some rounding errors).

Total 3,150 Tonnes CO2e

      • Miles 1 way – Reported journey for survey in miles – as this is easier for the public to describe their trip there
      • Km Return for vehicles – Converting into kilometres and then doubling for return
      • Survey Count – Those who describe their ‘Main Method’ for each transport method
      • Passenger Count – The passengers for the ‘Survey Count’
      • CO2 pp gm/km – CO2 per passenger (person) per kilometre (TNMT)
      • CO2 kg pp for all the journeys. Km return * CO2 pp converted into Kilograms
      • CO2 tonne for 750,000 – 750,000 is an estimate used by EBC for attendance ( 372 people in survey * 2000 is approx 750k) Then converted into tonnes
      • Petrol/Diesel – Private Cars with Internal Combustion Engine
      • Other – A mix of methods including powered wheelchairs, motorbikes and larger vehicles
      • Hybrid- An average of different types of hybrid – as not differentiated in survey
      • Taxi – Assumes mostly hybrid cars.

Many people will have multi ‘stage’ trips to get here. Estimates of the ‘second method’ will therefore be for a shorter distance. This will include those visitors who may have come a long way away but are staying reasonably locally and their journeys on these days are less, perhaps using Park and Ride buses, or local buses from the station or town centre. A rough estimate is around 350 tonnes . So the total for all journeys is close to 3,500 Tonnes. ( 3150 + 350)

There is no strong confidence attributable to this figure, as the 750k audience is an estimate and the sample size is small.

Survey questions

Two members of EEAN Transport Group did the interviews. This has the advantage that the interviewer can extract from the conversation the key pieces of data.  They tried to make the sampling as random as possible, by time of day, day of week and location. Having only 128 surveys for 372 people is not enough. The technology was a web-link with 3G on mobile phones to a Google form that feeds a Google Sheet .

Comparison with Eastbourne BC data 2022.

It is assumed that the EBC data is all collected from the online feedback form. It is possible that those strongly motivated or financially affected by the event, will be more likely to complete the survey. So for example the figure of 4 coaches with 180 passengers scaled up to 750,000 people would be a very high 40,000 passengers and 1,000 coach trips. It is assumed that the coach operator completed the survey rather that a random sample of the audience, which would be more in line with the EEAN survey. The coaches appearing to have much higher passenger numbers than those using local buses.

Likewise those who are local and less interested may spend only a few hours but on several days. They may be less likely to fill in the questionnaire. Their day may also include work, leisure and shopping and although perhaps driving to town they walked to Airbourne. The average distances are therefore higher with the EBC ‘model’ than in the EEAN survey.

How we should have done the survey

There were some good elements such as capturing multi stage trips.  For those staying locally the current questionnaire failed to tease out all the complexities of the trip for each day at Airbourne. The questions would be improved by asking

      • How far did you travel, from home to your holiday destination (Miles)
      • How did you get to your holiday destination
      • How many days are/were you on holiday
      • Of these how many are coming to Airbourne
      • How far did you travel, from where you are staying on holiday, to Eastbourne seafront (Miles)
      • How did you get from where you are staying today

Authors – Paul Humphreys and Derrick Coffee

New Parking Solutions For Eastbourne

The existing approach to parking is no longer enough

The current uninspiring consultation, on parking in Eastbourne Town centre, shows how nothing radical is being considered. Primarily it  does not help to meet  the Borough Council’s 2030 carbon target.

https://consultation.eastsussex.gov.uk/economy-transport-environment/eastbourne-informal-2022/

Eastbourne

There are a large number of underused car parks in the town. Drivers needs to be encouraged to use them, to free up road space. The obvious way is by differential charging and making it cheaper to park there than in the street.

There will always need to be some parking especially places for the disabled and less mobile. But cars are becoming ever bigger and wider and this is limiting the road space. Deciding that  parking availability is a top priority, makes buses passing cars an issue. It has also stopped any cycle lanes being built in the town centre.

London

Other areas of the country are facing the issue of parking head on. So it is worth looking at other councils to see what could be done. Limits by pollution, size of vehicle and CO2 are all possible. As are the removal of some free and pay parking spaces

Take Newham or Lambeth as examples. The latter is the latest council in London to introduce emissions-based parking fees.

Similar charges are expected elsewhere in England. Though they could be less complex with perhaps 4 or 5 bands. Owners of the most polluting cars can expect to pay more than twice as much as cleaner cars. There are now 26 different charges to park for an hour in Lambeth ( see above). It depends on a car’s tax band as to what you pay. Plus a surcharge is added for diesels. These emissions-based charges were shown to change motorists’ behaviour. A spokesman said: “People make fewer journeys or they choose a cleaner vehicle.”

https://www.lambeth.gov.uk/parking/emission-based-parking-charges/street-parking

So this may encourage families with 2 cars to drive into town in the smaller and greener one. Plus there will need to be more dedicated  spaces allocated to EV charging as well as  giving priority to ‘Car Clubs’

In summary, if we are really going to make a ‘modal shift’ in favour of active travel, we have to re-balance the use of road space, in favour of lower carbon options.

Paul Humphreys – EEAN Transport Group

The importance of ‘Right Tree, Right Place’

Our guest blogger for this week is Sarah Brotherton from Wild Bourne, the newest working group within the Eastbourne Eco Action Network:


One of the ways in which we can tackle the climate crisis is through tree planting. However, this may not be as simple as it seems, it is certainly not a quick solution, and it is definitely not a substitute for reducing CO2 and other greenhouse gas emissions.

Why are trees and woodlands so important in tackling the climate crisis? Because they store carbon within their structures, or biomass as it is technically referred to. However, it is worth pointing out that equal or even greater amounts of carbon are stored in woodland soils, so it is not just the tree it is what is below the tree that is also important. while woodland soils store substantial amounts of carbon, many grassland soils, particularly those of wet grasslands, and other wetland habitats store vastly more carbon than woodland soils1. Which is good to know, because although Eastbourne does not have a lot of tree cover, especially as woodland, it has large areas of wet grassland in the form of grazing marsh in the Eastbourne Park and Eastbourne levels areas.

East Sussex is one of the most wooded counties in England, with 17% woodland cover compared to the national average of 12.5%. But if you live in Eastbourne, that might seem a stretch to imagine given that Eastbourne and much of the surrounding landscape are not very wooded. That is because the bulk of woodland in the county is within the High Weald, north of Horam, which is in fact the most woodland landscape in the whole of England.

So, does this mean lots of tree planting should be happening in and around Eastbourne? Well, this is actually quite a complex question. Eastbourne has a completely different underlying geology to the High Weald, which has led to a different historical land use, and that in turn has led to the development of very different, but no less important habitats, which is why the landscape around Eastbourne and the Downs at this Eastern end are characteristically different from the low and high Weald of Sussex. Take the chalk grassland on Eastbourne’s doorstep on the Downs. This is an internationally rare habitat, with 80% of the original extent of chalk grassland lost since WWII. Much of the loss in the last 80 years has been to arable conversion on the dip slopes and spreading secondary woodland on the scarp slopes. Secondary woodland is tree and shrub cover that has naturally regenerated because of extensification – the opposite of agricultural intensification – the land is no longer actively managed.

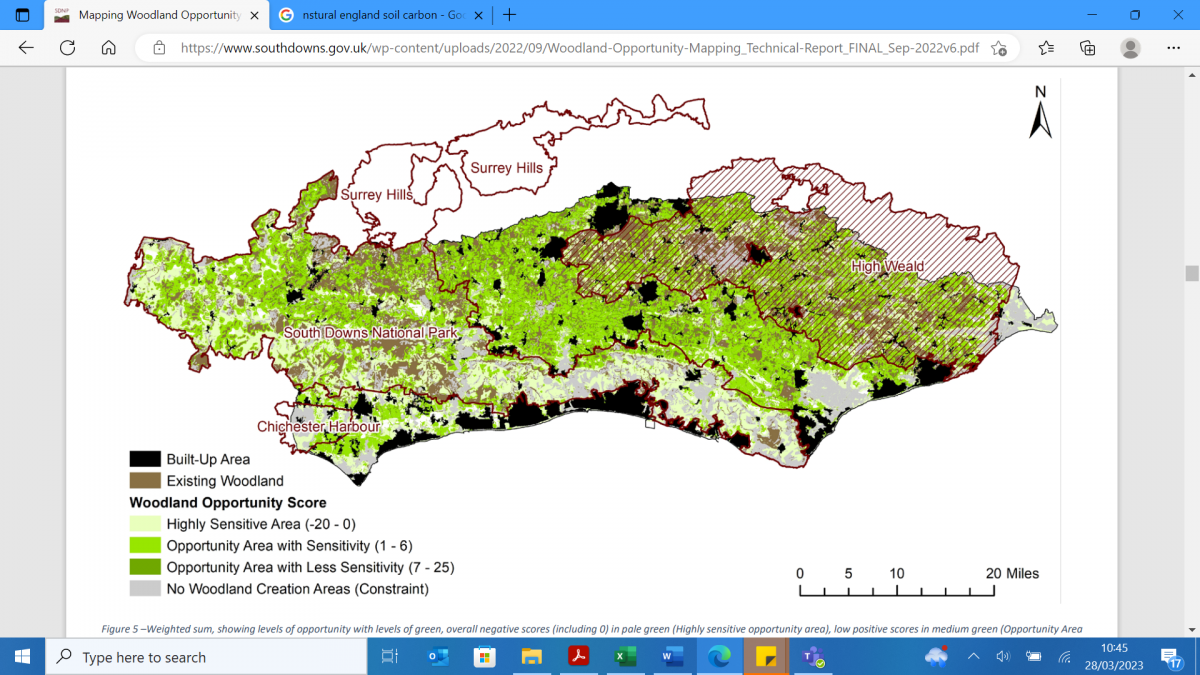
The South Downs National Park Authority in conjunction with Sussex Nature Partnership have produced an ArcGIS map which helps to sense check potential sites across both East and West Sussex, and the full extent of the South Downs National Park for woodland creation. This map draws on national and local data and is the best woodland opportunity mapping tool we have because it has been developed specifically to be used locally. It removes areas not suitable for woodland creation that are often other important habitats, it then weighs both positive and negative factors of the remaining areas across the counties to give one of three scores depending on how sensitive (suitable) the area is for tree planting. The one down side to this excellent tool is that is cannot be used to ascertain suitability for urban tree planting, as urban areas are screened out.

Image source: Mapping Woodland Opportunity in Sussex and the South Downs National Park Technical report, 2022

The map can be found by clicking on the link below. There is a storymap element which explains how the maps work, but if you scroll to the bottom there is an interactive map, which is zoomable:

Sussex and South Downs Woodland Opportunity Mapping (arcgis.com)

This mapping work suggests there is not a great deal of opportunity for woodland creation around Eastbourne. But that is OK, because Eastbourne has other naturally occurring habitats that are just as important if not more important in the fight against climate change. And anyway, the rest of Sussex, and in particular the High Weald AONB holds a place for us with its woodland cover, the same way that the Downs holds chalk grassland for the rest of Sussex. It is a reminder that looking after and restoring all habitats for biodiversity and for us is important, including for future generations, regardless of where those habitats are found.

1 R Gregg, J. L. Elias, I Alonso, I.E. Crosher and P Muto and M.D. Morecroft (2021) Carbon storage and sequestration by habitat: a review of the evidence (second edition) Natural England Research Report NERR094. Natural England, York

Come Back To Eurostar

EUROSTAR – THE GREENER OPTION!


In the month, when train fares increased a record 5.9%, the Government is failing to support direct train services from the south coast to the continent. Not helped by the ongoing indecision around an upgrade to the line and rolling stock, from Hastings to the downgraded Ashford (International).

Diesel Units from Eastbourne to Ashford (International)

Meanwhile on the continent there has been a big move from short distance flights to train travel – including through a growing number of cheap sleeper services to major European destinations. The UK is simply falling behind.

Continuing absence of international rail connections between the two counties and the continent (Paris, Brussels, Amsterdam) and growing pressure for capacity increases at Gatwick Airport (2nd runway), sit uncomfortably together in the context of supposed commitment to sustainable, low carbon transport choices.

We know that Eurostar is having to operate services from London, St Pancras with empty seats due to increased time needed for passport formalities post Brexit, and the need for punctual departures. This may have marginalised the business case for Ashford International stops. We also know that Secretary of State for Transport Mark Harper, MP, visited his French counterpart, Clément Beaune, to discuss eliminating border related issues such as queues at London and Paris terminals. That might help bring back Ashford services – we await results.

We are sure that restoration of international services to/from the important rail hub of Ashford presents significant opportunities for travellers both to and from the near continent and would do a great deal to promote currently bypassed but outstanding tourism offer of Kent and East Sussex – without creating more road traffic: our MPs and Local Authorities should wake up and shout about this!

It is worth noting that pre-Brexit, and pre-pandemic, Eurostar had captured from the airlines 80% or more of the market for travel between London and Paris/Brussels*. If Mark Harper succeeds with his French opposite number in removing admin bottlenecks, then new, already planned services to Geneva/Bordeaux/ Frankfurt could follow, further reducing volumes of air traffic.

In conclusion: the neglect of greener travel options is in sharp contrast to the support for more destructive, costly roads – and Gatwick’s second runway.

The climate wins; we all win.

Derrick Coffee

*Source: Eurotunnel, 2019.

Gatwick Airport Expansion Plans

Speech at Eastbourne Borough Full Council Meeting

Background:

Gatwick airport have requested Eastbourne Council’s support for their plans to expand the airport capacity from 46 to 80 million passengers a year. Eastbourne’s Scrutiny Committee met with representative of Gatwick Airport to question them over their plans.

The Recommendation of the Scrutiny Committee to the Full Council was as follows:

1. Makes any support for Gatwick Airport’s Northern Runway Project conditional on Gatwick Airport’s production and pursuit of a credible plan, in partnership with its Scope 3 stakeholders, to work towards carbon neutrality across its Scope 3 emissions by 2030.

2. Calls on any Government to mandate a faster transition to low-carbon aircraft fuels, and to provide meaningful support to the fuel industry, airlines, manufacturers and other aviation industry stakeholders to achieve this.

Speech by David Everson: Chair EEAN Transport Group to the Full Council

The Scrutiny Committee propose you let the airlines and Gatwick airport  work towards carbon neutrality by 2030 and that you encourage government to support a faster transition to sustainable flying.

On the Gatwick Website it states that the UK Sustainable Aviation Industry has a road map for net zero by 2050 not 2030!

The government’s own official advisor, the Climate Change Commission, has stated ‘that the 6th Carbon Budget set for the government will be breached if net airport expansion is not significantly constrained.’

What is special about the 6th Carbon Budget? It covers the period 2033 -2037. Why will the Carbon budget be breached? Because for the first time the UK will have to start to include all the CO2e emitted by international flights leaving the UK.

The Department of Business Energy and Industrial Strategy, this month, published the UK’s Greenhouse gases emissions. It showed that the UK produced 427 million tonnes of CO2e, of this the airline industry was responsible for about 2% of the emissions due primarily to domestic flights.

It is important to note these figures do not include any international aviation emissions for flights leaving the UK. If they were, it would add another 37M tonnes of CO2e to the total, this would bring the total figure for aviation to a staggering 10% of all the UK’s annual emissions.

So the CCC are saying to the Government do not allow airports to expand if you want to meet your Carbon budget.

What about improvements to make the aviation industry more sustainable

Sustainable fuel for example.. – At the World Economic Forum in Davos January this year, the corporate signatories of ‘Clean Skies for Tomorrow’ pledged to…… ‘achieve sustainable aviation fuel blend of 10% in global jet fuel supply by 2030. … That means by 2030 – 90% of aviation fuel will still be  fossil fuels!

The International Energy Authority (IEA) commented in Sept 2022 – ‘renewable synthetic Kerosene is relatively far from commercialisation’

What about improved Aircraft Design

The International Energy Authority (IEA) in Sept 22 talks about better aircraft designs reducing GHG emissions but state… ‘New aircraft are more efficient – but this has been insufficient to keep up with growth demand’.

What about Economics

I think the expansion of Gatwick airport will harm Eastbourne’s economy by allowing more Brits to travel abroad rather than staying in the UK to holiday.

Summary

I ask you to publicly and strongly reject Gatwick’s request to support their expansion. To do otherwise would make your declaration of Carbon Neutral 2030 a sham!

The Aviation Industry is not sustainable and will not be for at least a quarter of a century.

David Everson: Chair EEAN Transport Group to the Full Council


Driving to Airbourne

In Eastbourne Borough Council’s commitment to a carbon neutral 2030 one of the most contentious sources is Airbourne. An issue where some councillors have resigned. However their recently published report, on the event’s 2022 carbon footprint, showed that 96% was down to ‘audience’ travel. Whereas very little was linked to the aircraft

During the event the council undertook a survey of 710 people. They found 74% came by private car. Using Kolin Schunks carbon tool these journeys accounted for 95% of all the ‘travel’ CO2e. This being 91% of the CO2e for everything at Airbourne.

To be fair 2022 was not typical and due to industrial action had less rail travel but the clear message is, even in a ‘normal’ year, most carbon will be down to private car trips.

People might think that with more electric vehicles the carbon footprint will become very much less. However EVs with low mileage have big manufacture and disposal carbon footprints. With a trend for being ever larger and 15% heavier, than the fossil fuel equivalent, they are not the solution for everything and they still take up the same road space

Then with the raw data it was possible to have a ‘rough and ready’ estimate for traffic. Where assuming up to 10km was driven in Eastbourne and within 40km in East Sussex. This showed only 13%, of the total distance driven, is within Eastbourne and a further 21% elsewhere in East Sussex. So most of the event’s CO2e is not directly linked to the Eastbourne area.

Below are some of the measures that would reduce car trips. Experts suggest it is not enough to only use ‘pull’ measures like cycle and bus lanes. There has to be ‘push’ measures, which are equally important for the rest of the year.

Graphic from TUMI

TUMI

So in conclusion, if Eastbourne wants to reduce the carbon footprint for Airbourne, they need to discourage car trips. They would have to implement measures such as car bans, higher parking charges and tighter parking management. The question is does anyone have the commitment to do this?

Paul Humphreys – Transport Group