Commenting on Wealden Local Plan

Introduction

Whether you live in Wealden or on the borders of Eastbourne, Lewes or Rother additional housing growth, in the Wealden area, will affect you. So you should comment on the Draft Local Plan.

“Wealden District Council is preparing a new Local Plan. [it] will be the key planning document for Wealden District. Once adopted, the Local Plan will form part of the Development Plan for the District, replacing all existing local plan policies and will be used to assess and make decisions on planning applications.” There will be 16,000 new houses of which around 8,000 have already been planned for .

It is a challenge to go through all the background documentation. The consultation itself is over 200 pages. So this blog has had to be selective. To begin with here are the top 8 areas in terms of new housing

Most of this will be in South Wealden and especially on the borders of Eastbourne. From this table you can see that much of the local area is already ‘confirmed’. In Willingdon for example all the space is already committed apart from some ‘windfall’. So you may feel it is too late. This is not the case. Within the plan are some policies that have some merit and these should be supported.

Here are some links you will need . The Wealden Local Plan itself including a short video . Then the Consultation Portal – Where you create an account and add comments

Background

The lack of a local plan has made Wealden vulnerable to developers who were likely to win, if they appealed, when their planning submission was rejected. With a plan the council has more control of where housing can go. Without a plan the growth of housing could be higher. If there is a proposed housing development ,that you do not agree with, then you can highlight this in your submission, ideally linking it to the relevant policy.

One of the key concerns is the transport infrastructure. Before reading the rest of the blog you may wish to read this blog, on how over optimistic future predictions , are used by councils and developers to the detriment of residents.

Discussions with relevant district officers, councillors and directors suggest there may be residents who do not support a greener and more active travel agenda . Therefore it is important to support these policies and schemes.

Below are a number of the key chapters in the consultation that are worth commenting on. :-

Chapter 3 is Vision and Objectives

Suggest you strongly support “Sustainable and active travel’ but make points as to how this is not being addressed.

There has been no evidence of any increase in public transport, wheeling, cycling and walking. Many County, District and Borough plans refer to a planned shift away from cars . This has never been delivered. In fact East Sussex CC has not achieved any change in the mix of transport and total vehicle trips have simply increased

Suggest the need for high level plans across multiple sites. There are many examples where each site has its own access road and no attempt made to have public or active travel routes through these developments . For example at Horsebridge there is an area with over 5 different adjacent estates with no co-ordination of the access across them. A house that you want to visit, maybe only a few hundred meters away, but the car may need to exit one estate and then enter another one. On top of this the connections to the Cuckoo Trail, tell cyclists to dismount and push over 200m on sandy narrow tracks to get to the estates. Discriminatory especially to those who use mobility scooters, elderly or with heavy e-bikes

There needs to be a clear strategy to deal with the effect of all this housing growth on the current residents, where the existing streets might have more ‘permeability’ and could then be used as ‘rat runs’.

Plus stress more emphasis needed on actively supporting greater biodiversity, perhaps in adjacent areas, to counteract the consequences of this extra urban housing. Perhaps though Section 106 agreements.

There does not seem to be enough on encouraging reaching net zero through the design of housing in terms of their location and the wider community. This would strongly support higher insulation, solar panels, EV charging and heat pumps

Chapter 4 – Spatial Strategy

Suggest you strongly support “4.18 The benefits of a 20-minute neighbourhood concept are extensive, providing health, social, environmental and economic benefits to people and communities. Additionally, the concept would seek to tackle many of the issues that we need to address through our plan such as reducing carbon emissions, helping people to become more active, reducing mental health issues and loneliness, improving our town and village centres, making our settlements great places to live as well as improving access to affordable healthy food.

Support the statement in “4.26 East Sussex County Council’s Local Transport Plan 4 Consultation(12) supports the 20-minute neighbourhood or the ‘complete, compact and connected neighbourhood’ approach by providing a shift towards supporting healthy lifestyles by walking, wheeling or cycling and more active travel, as well as through the design of public places and healthy places through integrated neighbourhoods.

So from the above, mention your support for higher density dwellings in the centres which should have access to a mix of leisure, shopping and business all nearby and accessible by bus or active travel. You could also add support for 20 mph and school streets

Support – “Policy SS9: Health, Wellbeing and Quality of Life”that creates improved connectivity and supports healthier and more active lifestyles

Chapter 5 – ‘Climate Change’

Generally strongly support

CC1 Net Zero Development Standards – New Build. Support Policy but would prefer a clearer steer around residential standards of insulation, solar, batteries and heat pumps. There are no examples locally which could be seen as evidence of the ideal higher standards

CC4 Carbon sequestration, Support Policy but make the point, large areas of land are being urbanised and it is unlikely that sequestration could be achieved in or around the new housing estates

Policy CC5: Renewable and Low Carbon Energy. Agree with the principle of “Support will be given to community led energy schemes where evidence of community support can be demonstrated”

Policy CC6 Water Efficiency . Support the principles though make the point it is partly the cumulative effect of all these new houses which will determine how both water and waste (Southern and South East Water) cope. Some of the pumping stations, pipes and sewage works are already under strain

Policy CC7 Managing Flood Risk. Support the principle though areas such as between Polegate and Willingdon have always been susceptible to flooding. Concreting over will add to the problem across all the low lying estates. Make reference to the work the Environment Agency are undertaking around flooding and rising sea level.

Policy CC8 Sustainable Drainage. Support the principle such as in CC7 but perhaps question whether previous experience shows if this been dealt with in the past

Chapter 9 Infrastructure

Policy INF1 Infrastructure provision, delivery, and funding. “The provision of infrastructure facilities such as those relating to healthcare and education should be provided” Stress there needs to be guarantees of them being built and that you have concerns based on recent sites that the delivery of schools and health centres may not happen. This is due to the higher build costs and the funds that health and education may have. Plus a need to adhere to DfT’s “Guidance on Land Use/Transport Interaction Models”

Policy INF2 Sustainable transport and active travel– Support this policy. However the local housing developments simply fail on the criteria listed. No attempt appears to have new been made to create viable routes through multiple estates . Routes identified in the LCWIP, that are supposed to be on these sites ,have not been taken into consideration. Good examples would be alongside the railway from Hampden Park to Polegate (such as routes 312 and 225). Recent experience shows that proposed bus and cycle lanes are very vulnerable to being dropped through pressure from those who do not support them. They must be installed.

Policy INF5 Safeguarding of Infrastructure– Support the concept but as already mentioned there are many potential active travel routes in LCWIP that have been ignored through planning.

Policy INF8 Open space, sports and recreation provision– Suggest make the point – There are large areas of open land that have been lost and this cannot be rectified by a few small parks

Chapter 10 Design

Policy DE1 Achieving well-designed and high-quality places. Support the aim however challenge most of the new developments. These are car centric, low traffic neighbourhoods that do not allow through traffic. Most of the current developments have similar housing and add very few community buildings. The road layouts are meandering and do not support more direct routes for active travel . They also do not support bus routes and this will mean when funding runs out residents without a car will struggle. Perhaps building housing for elderly people should be closer to amenities and bus routes on main roads. In ‘Manual for Streets’ it explains the consequences of building ‘car-centric’ estates that make active travel within the estate and to other destinations problematic

Closing comments.

Please read any other chapters and additional documents, if you want to look into this plan in more detail. You have until Friday 10th May 2024 to submit your comments

Local Transport Plan 4– Guidance Notes

Introduction

Note- Following comments and feedback new sections have been added, at the end, in indigo – 28/01/24

If you are looking to comment on the East Sussex Local Transport Plan (LTP4), you may find this blog helpful. Hopefully it provides some general guidance. Please remember a short blog cannot address all the issues.

Overall the consultation asks you to score a number of nebulous and intangible statements. For most it is hard to disagree with them. You are asked to provide an overall score on categories that are open to interpretation. These might be  for example – strongly agree, agree …..disagree.

However the questions may cover areas where your response might be more nuanced.

As background you may find this blog on the shortcomings of the consultation process of some relevance.

Governance and Reporting

Most project methodologies such as Prince2 have monitoring, interim targets, reports and exception reporting. Most of these are found in the Council’s Carbon Plan .

Section 9. Governance “ Provide oversight of the delivery of the action plan .. Annual reporting to Cabinet and full County on progress “

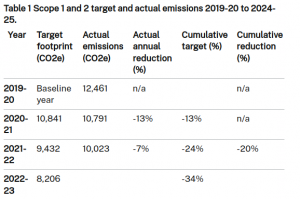
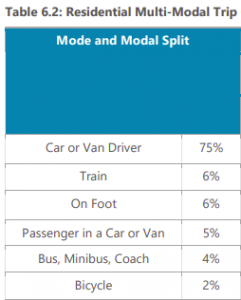
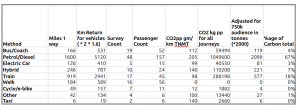
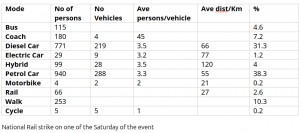
For transport an equivalent could be modal share. (The split between cars, walking, cycling ,bus and rail). This could be either around private transport (70%) or perhaps for active travel (walking, wheeling, cycling and buses) (20%). Other metrics such as the share of EVs or carbon footprints are perhaps down to national policy.

There were predicted modal share changes, in LTP3,  but there appears to be no review undertaken. It is also normal for plans and projects to have a ‘lesson learnt’ process at the end. So for LTP4 , following the approach elsewhere , there should be:-

•  5 year interim targets. With perhaps one or two clear definable metrics.
•  Review every 2 years
• Description of the new projects for the following 2 years.

This is described in Theme A Section 4.3 “potentially suitable KPIs [ Key Performance Indicators] …. We will establish appropriate governance to oversee the development, delivery and benefits realisation arising from schemes and policies included in this strategy.”

Action – Request that the governance, reporting and targets are more clearly stated

Modal Shares

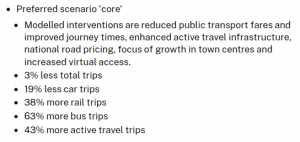
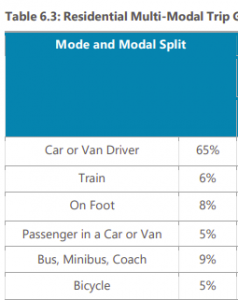
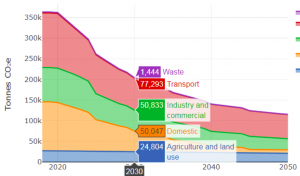
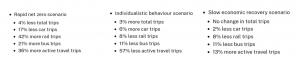
In the plan there are a number of scenarios provided. All of them are compared to a 2050 ‘Business as Usual’ scenario . This one below is one of the more ‘optimistic’ of them. All have, to some extent, fewer cars trips and more active travel

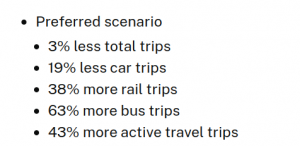
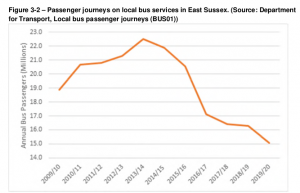
You may want to consider, as stated in LTP4, that cycle journeys are recently down. Bus journeys are still not at pre-pandemic levels and the plans for bus lanes have been severely scaled back. There has never been any evidence, of a long term reduction, in the modal share and total trips for cars. This is excluding systemic changes resulting from Covid.

The blog on the dangers of unverifiable modelling may be of interest

Action. Ask for more information how the ‘numbers’ behind the scenarios can be validated

Change of Approach by the Council

Campaigners have seen no evidence, of a change in mindset, as suggested by the LTP4 vision. This month the local bus lane plans have been severely reduced, 20 mph schemes are not considered for wide areas, cycle schemes remain very low, but a priority around cars and large road schemes remains in place

Here is an example from Transport Scotland for a clear direction to reduce national car kilometres by 20%.

The route map does not aim to eliminate all car use. We recognise that would not be realistic or fair, especially for journeys undertaken by disabled people or in rural areas where sustainable travel options may not always be available or practical. Rather, the route map encourages all of us to reduce our over reliance on cars wherever possible and identifies four key behaviours that we want everyone in Scotland to consider each time we plan a journey:

• make use of sustainable online options to reduce your need to travel;
• choose local destinations to reduce the distance you travel;
• switch to walking, wheeling, cycling or public transport where possible;
• combine a trip or share a journey to reduce the number of individual car trips you make, if the car remains the only feasible option.

Action – Ask how the council officers and councillors intend to change their approach to transport to support the scenarios they outline in the Plan.

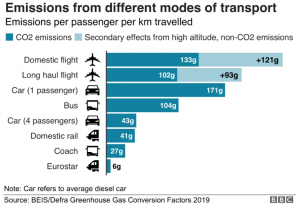
Pollution and Decarbonisation

There are those who think that the issue of carbon can be addressed by a shift to Electric Vehicles (EVs).  Instead of the LTP’s ‘People and Places’ the alternative of ‘Avoid Shift Improve’ is much more focussed on active travel, de-carbonisation and alternatives to the private car, even if electric.

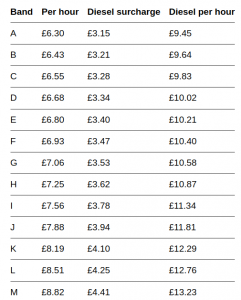
For parking perhaps propose charges based on either CO2 or else around the size of the vehicle. You may also wish to comment on the extra journeys generated through the proposed large road schemes, such as the ‘duelled’ A27.

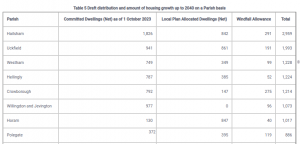
One aspiration, featured in this and the previous LTP, was linking ‘Land Use Planning’ and Transport. There is very little evidence for recent housing developments that this is being take seriously.

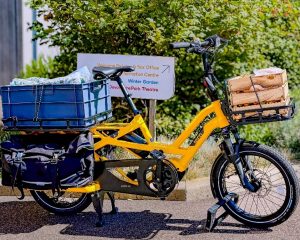
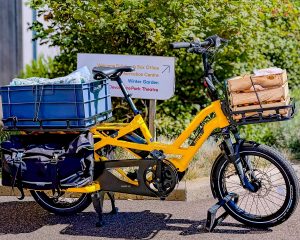
Action – If you want to encourage less polluting vehicles then ask how they will be encouraged ( E-bikes, e-scooters, and smaller greener cars)

Action – Ask for ESCC to be more positive in planning applications in supporting active travel and buses in the large car-centric housing developments especially in South Wealden.

Cycling and Walking

The Plan has many references to more walking, wheeling and cycling. However consider from data provided by ESCC, only £165k has been spent, on cycle infrastructure in the last 4 years.

Contrast this with 6.61 “Reviewing and delivering the Local Cycling and Walking Infrastructure Plan – which includes a robust pipeline of deliverable active travel schemes for networks and places – ensuring a balance of schemes to support walking, wheeling and cycling.

Whatever is written in the LCWIP and in the Council’s budget book, the actual spend on cycling is negligible. The plan ’admits’ that those cycling once a month, in the county, have dropped, in 5 years, from 15% to 10% and is now well below the England average

In terms of walking there has been progress . However  schemes that might help active travel such as 20 mph, Low Traffic Neighbourhoods , modal filters and School Streets require a change in approach from officers and councillors.

Action 1) Ask for evidence of investment, not from the Budget Book, but of actual schemes they will build.

Action 2) In the Health Impact Assessment how the general health of the population will be prioritised . This is around reducing obesity, lack of exercise and multiple chronic conditions

Scenarios

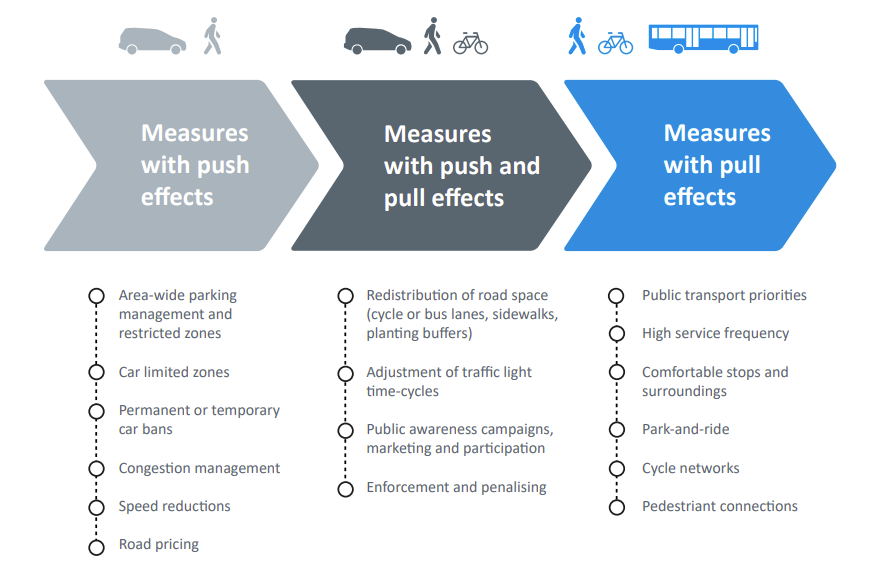
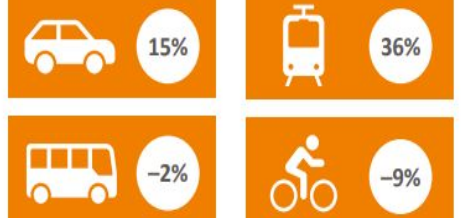
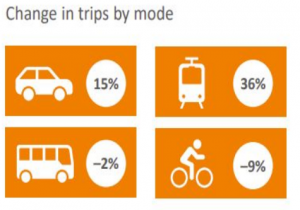
The problem of predicting future levels of traffic, is that even with no interventions, the  so called ‘Business as Usual’ (BAU) in 2050, is different to now. Here is an example from Transport for South East ( TfSE). This is

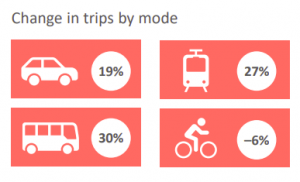
from their BAU of 2050.  Then the various others scenarios are on top of this. In other words how much the trip balance will change, from BAU, with various interventions. (Note the icon with a cycle is for walking as well)

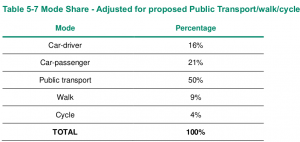
So the BAU is likely to be similar for East Sussex.  Here are various scenarios from LTP4. Unless one of them is chosen then there is no effective track on progress. This may suit the Council as no real accountability exists. Plus  the option of having 5 year reviews is then less valid. 

Targets

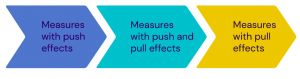
Once an agreed scenario, as above, is agreed there has to be a clear plan to get there. This is called ‘backcasting’ and is the opposite of forecasting. (How do we get there v what might happen). In the image below it shows how it should be broken down into smaller time periods. Perhaps every 5 years.

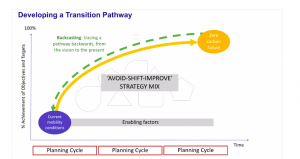
So in LTP4 there are many schemes and policies but there is no guidance, for readers, as to what would deliver the most change. During the initial workshops there were requests, to provide details as to how the algorithms generated the various scenarios . Otherwise it is a ‘black box’ with outputs that the public have to take on trust. Change would partly be achieved  by the schemes and projects listed in LTP4. (Of course some change will also be through National Government). Otherwise you may mention, in your consultation reply,   certain schemes that sound good to you, but actually  deliver less, in terms of overall change,  than another good alternative. 

The targets could include :-

  • modal shares
  • pollution NOx PMx
  • road traffic incidents
  • children specific  – such as trips to school
  • transport poverty of each council , (that shows Eastbourne to be nearly the worst in the South of England.)

Ideally ones that are already recorded and for which there are comparisons across the UK. 
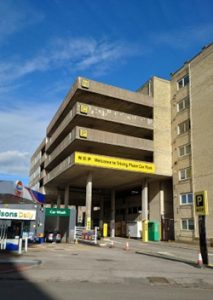
Cars

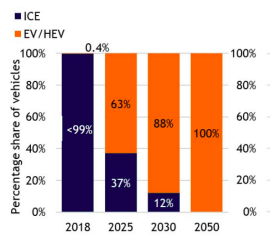
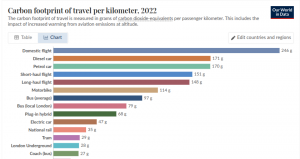
If the most important consideration is reducing carbon then moving from the ‘Internal Combustion’ to Electric Vehicles will do this. Especially within the county where the manufacture and disposal is elsewhere as is most of the  electricity production. 

However cars are getting bigger and heavier each year. ( 0.5 cm wider p.a) . They no longer fit in car parking places.  Brakes and tyres create PM2.5 pollution. When in the road they make passing harder and this increases congestion and road damage. Smaller, lighter cars need to be encouraged. Currently an EV charged at home is cheap per mile and this may encourage even more road miles.  If you think road charging might reduce congestion look at this reportAs mentioned earlier ‘Avoid Shift Improve’ would encourage alternatives such as more micro-mobility. 

Paul Humphreys EEAN -Transport Group
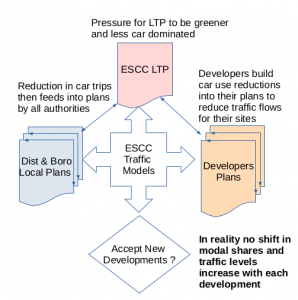
Can We Trust Transport Modelling?

Are you intending to comment on East Sussex County Council’s Local Transport Plan 4 ( LTP4). For those who want to review the proposals the future projections for transport look good. Predicted to have fewer car trips whilst buses, pedestrians and cycling numbers are all up. That is  good news! …. but as a reminder LTP3 had similar aspirations

Perhaps now is the time to ask why planners are generating such positive scenarios, that you may feel are not achievable. The predictions are derived from complex algorithms. Often the process is described as a ‘black box’. The definition of which is ‘a complex system  whose internal workings are hidden or not readily understood’ . That makes anything it produces as hard to verify

Let us examine the accuracy of such models. From a lay person’s perspective the optimistic scenarios, over the last 10 years, never seem to have been delivered.

This table below , with 19% fewer cars trips, is from the LTP4. Some scenarios deliver an even larger drop in car trips. [As background, on a number of the workshops it had been asked, if some explanation could be be provided as to how the ‘black box’ generated these outputs]

In sharp contrast, in LTP4 it does admit that, across the county, the number of residents cycling has reduced by around 33% in 5 years. Plus there was a large decrease in bus provision over 20 years and even with an increase in funding, bus passengers are only 90% of pre-Covid numbers.

The largely ‘positive’ models are endemic throughout the planning process. Over the last 10 years many focus on a 10% ‘modal shift’, away from cars, towards buses and cycling. However these predictions then feed into other local plans and permeate through the whole planning process.

As an example ESCC’s ‘Hailsham, Polegate to Eastbourne corridor ‘, from 10 years ago, predicted a 10% reduction in modal share for cars. This scenario is then used by developers, on that key route, to show the extra traffic, from their developments, will be offset by the modal shift this original report had predicted. The example used here is taken from the Transport Assessment for Hindsland in Willingdon. (see Tables 6.2 and 6.3)

Method of Travel – Currently (left) and with planned improvements (right)

Notice that the developers take current traffic data and then adjust to the new modal share. So that cars, including passengers, are down from 80% to 70% and this would suggest traffic levels will be lower. To compensate, for the lower private transport, there is an increase in bus trips from 4% to 9%. That is a 125% increase, alongside  an increase for cycling up 150%. But there has never been a demonstrable increase in either.

This general approach, to overstating modal shift, is also seen in Eastbourne, by developers, on schemes such as the Magistrates Court and TJ Hughes. The positive transport assessments, produced around higher levels of active travel, seem to satisfy both developers and councils. They do not alter the reality.

Now look at Black Robin Farm (SDNP/23/04238/FUL). Aecom ,in their transport review for Eastbourne Borough Council, provided a comprehensive analysis of transport options. Their algorithm produced –

The reality check is that for Eastbourne 5% of trips are by bus  and on the Downs nearer 10%. However there is no explanation as to how 50% Public Transport could ever be achieved. Plus in this scenario cycling at 4% would be an increase from an original estimate of 1,000 to 4,000 trips p.a. Cynics might think the data was to convince South Downs National Park that there would not be a high demand for car parking. Based on the  100,000 visitors predicted p.a.

Many of these models have shown to exaggerate the modal shift away from private cars. To provide reassurance, models need to be validated, to see how accurate they were. The Government’s Transport Analysis Guidance (TAG)  “provides an overview of good practice in planning the evaluation of transport interventions to ensure robust evidence can be collected about the difference that they are making in practice. It is intended to support evaluation planning and stronger business cases for a range of transport interventions in terms of mode, type of intervention” Model guidance from Govt

In summary we are asked to take on trust the ‘black box’ approach, that transport planners are using, when our lived experience would suggest something different. Perhaps now is the time to reassess the accuracy of the predictions. If you have doubts then make this clear in your comments for LTP4 and question them about their methodology

Paul Humphreys EEAN Transport Group

Council Consultation Shortcomings

Introduction

Consultations are considered valuable for getting community and stakeholder perspectives. There is even an expectation, from the Government, that where applicable consultations may take place. However particularly in transport, some councils can use them to block change. In contrast as an alternative other councils, especially during Covid, tried out schemes. Then the public could experience the proposed changes and decide if they like them.

It is becoming increasingly clear that relying on consultations  has limitations. The more council consultations, you are involved in,  the more the failings become apparent. These include :-

Question Bias. Written to deliver the ‘desired outcome’. By writing questions in a particular way the options are limited. Such as the one for local cycling, where there was the choice of nothing or designs that were substandard. Not what the ‘users’ wanted. There is often no easy way to specify  a different or better solution. If you choose ‘nothing’ the funds are then lost.

Limited Representation: Consultations attract those who have strong opinions and miss out the majority. On top of this, certain marginalised communities with limited resources, may not have equal access. Leading to an incomplete understanding of the community’s needs. As an example the bus consultation along Seaside is through one of the most deprived wards in the town and has low car ownership. Should the local residents be given greater weight than those who are more vocal but live elsewhere ?

Tokenism: A recent consultation on the town centre had 64% disagreeing or strongly disagreeing with the proposal. The County Council still proceeded. This leads to frustration and distrust among participants for future consultations.

Lack of Expertise: Public consultations often involve those who may not understand the complexities of planning issues or the regulations . Unfortunately not everything can be simplified.

Manipulation : Consultations can be susceptible to manipulation or bias. Those with greater resources or more power may dominate the outcome, drowning out the opinions of others. Special interest groups can exert undue influence and this is often true on both sides of a debate

Constraints: Consultations can be both time-consuming and resource-intensive, requiring significant effort to organise and manage. This can lead to delays in the planning process and using up valuable funds that could be used to deliver real change . It can also be used as a tool to allow councils not to proceed, which may have been their original preference. This can often be the case with anything that adversely affect car drivers. There is pressure for councils to develop ‘green’ plans that they do not really want. This happened during Covid when the county was funded by the Government to implement temporary solutions. If councils can show that there are negative comments they can drop the scheme and keep the funds.

Resistance to Change: Public consultations may reinforce the ‘status quo’, as many people are resistant to any change. Often only a narrow cross-section of the local demographic tends to engage in council consultations.  Often with a preponderance of older people taking part, whilst the views of young people and students, who are mostly reliant on public transport, are not usually represented well enough. However often controversial schemes are then accepted and most would not want it back the way it was.

Social media – Assuming many residents do not fully understand or even look at the documentation, there is the strong evidence of people being influenced by ‘simple summaries’ on social media. This is an increasing problem. As an example a recent local social media campaign had the suggestion that, in the current bus consultation, all of Seaside would become a bus lane and there would be no parking. This is not even close to reality. However these simple messages can then be the main source of misinformation for people completing the online consultation.

Compromise : There is little scope, for those with different views, to come to some common agreement. Often the consultants will speak to the different sides in isolation. When perhaps, through a wider meeting, a compromise could be achieved.

Summary

Consultations can be used in a number of ways :-

  • genuinely find residents opinions
  • ensure the desired outcome from the council’s perspective
  • allow councils to drop schemes they did not actually want
  • rubber stamp a decision that had already been taken

Paul Humphreys  EEAN Transport Group

New Parking Solutions For Eastbourne

The existing approach to parking is no longer enough

The current uninspiring consultation, on parking in Eastbourne Town centre, shows how nothing radical is being considered. Primarily it  does not help to meet  the Borough Council’s 2030 carbon target.

https://consultation.eastsussex.gov.uk/economy-transport-environment/eastbourne-informal-2022/

Eastbourne

There are a large number of underused car parks in the town. Drivers needs to be encouraged to use them, to free up road space. The obvious way is by differential charging and making it cheaper to park there than in the street.

There will always need to be some parking especially places for the disabled and less mobile. But cars are becoming ever bigger and wider and this is limiting the road space. Deciding that  parking availability is a top priority, makes buses passing cars an issue. It has also stopped any cycle lanes being built in the town centre.

London

Other areas of the country are facing the issue of parking head on. So it is worth looking at other councils to see what could be done. Limits by pollution, size of vehicle and CO2 are all possible. As are the removal of some free and pay parking spaces

Take Newham or Lambeth as examples. The latter is the latest council in London to introduce emissions-based parking fees.

Similar charges are expected elsewhere in England. Though they could be less complex with perhaps 4 or 5 bands. Owners of the most polluting cars can expect to pay more than twice as much as cleaner cars. There are now 26 different charges to park for an hour in Lambeth ( see above). It depends on a car’s tax band as to what you pay. Plus a surcharge is added for diesels. These emissions-based charges were shown to change motorists’ behaviour. A spokesman said: “People make fewer journeys or they choose a cleaner vehicle.”

https://www.lambeth.gov.uk/parking/emission-based-parking-charges/street-parking

So this may encourage families with 2 cars to drive into town in the smaller and greener one. Plus there will need to be more dedicated  spaces allocated to EV charging as well as  giving priority to ‘Car Clubs’

In summary, if we are really going to make a ‘modal shift’ in favour of active travel, we have to re-balance the use of road space, in favour of lower carbon options.

Paul Humphreys – EEAN Transport Group

Come Back To Eurostar

EUROSTAR – THE GREENER OPTION!


In the month, when train fares increased a record 5.9%, the Government is failing to support direct train services from the south coast to the continent. Not helped by the ongoing indecision around an upgrade to the line and rolling stock, from Hastings to the downgraded Ashford (International).

Diesel Units from Eastbourne to Ashford (International)

Meanwhile on the continent there has been a big move from short distance flights to train travel – including through a growing number of cheap sleeper services to major European destinations. The UK is simply falling behind.

Continuing absence of international rail connections between the two counties and the continent (Paris, Brussels, Amsterdam) and growing pressure for capacity increases at Gatwick Airport (2nd runway), sit uncomfortably together in the context of supposed commitment to sustainable, low carbon transport choices.

We know that Eurostar is having to operate services from London, St Pancras with empty seats due to increased time needed for passport formalities post Brexit, and the need for punctual departures. This may have marginalised the business case for Ashford International stops. We also know that Secretary of State for Transport Mark Harper, MP, visited his French counterpart, Clément Beaune, to discuss eliminating border related issues such as queues at London and Paris terminals. That might help bring back Ashford services – we await results.

We are sure that restoration of international services to/from the important rail hub of Ashford presents significant opportunities for travellers both to and from the near continent and would do a great deal to promote currently bypassed but outstanding tourism offer of Kent and East Sussex – without creating more road traffic: our MPs and Local Authorities should wake up and shout about this!

It is worth noting that pre-Brexit, and pre-pandemic, Eurostar had captured from the airlines 80% or more of the market for travel between London and Paris/Brussels*. If Mark Harper succeeds with his French opposite number in removing admin bottlenecks, then new, already planned services to Geneva/Bordeaux/ Frankfurt could follow, further reducing volumes of air traffic.

In conclusion: the neglect of greener travel options is in sharp contrast to the support for more destructive, costly roads – and Gatwick’s second runway.

The climate wins; we all win.

Derrick Coffee

*Source: Eurotunnel, 2019.

Gatwick Airport Expansion Plans

Speech at Eastbourne Borough Full Council Meeting

Background:

Gatwick airport have requested Eastbourne Council’s support for their plans to expand the airport capacity from 46 to 80 million passengers a year. Eastbourne’s Scrutiny Committee met with representative of Gatwick Airport to question them over their plans.

The Recommendation of the Scrutiny Committee to the Full Council was as follows:

1. Makes any support for Gatwick Airport’s Northern Runway Project conditional on Gatwick Airport’s production and pursuit of a credible plan, in partnership with its Scope 3 stakeholders, to work towards carbon neutrality across its Scope 3 emissions by 2030.

2. Calls on any Government to mandate a faster transition to low-carbon aircraft fuels, and to provide meaningful support to the fuel industry, airlines, manufacturers and other aviation industry stakeholders to achieve this.

Speech by David Everson: Chair EEAN Transport Group to the Full Council

The Scrutiny Committee propose you let the airlines and Gatwick airport  work towards carbon neutrality by 2030 and that you encourage government to support a faster transition to sustainable flying.

On the Gatwick Website it states that the UK Sustainable Aviation Industry has a road map for net zero by 2050 not 2030!

The government’s own official advisor, the Climate Change Commission, has stated ‘that the 6th Carbon Budget set for the government will be breached if net airport expansion is not significantly constrained.’

What is special about the 6th Carbon Budget? It covers the period 2033 -2037. Why will the Carbon budget be breached? Because for the first time the UK will have to start to include all the CO2e emitted by international flights leaving the UK.

The Department of Business Energy and Industrial Strategy, this month, published the UK’s Greenhouse gases emissions. It showed that the UK produced 427 million tonnes of CO2e, of this the airline industry was responsible for about 2% of the emissions due primarily to domestic flights.

It is important to note these figures do not include any international aviation emissions for flights leaving the UK. If they were, it would add another 37M tonnes of CO2e to the total, this would bring the total figure for aviation to a staggering 10% of all the UK’s annual emissions.

So the CCC are saying to the Government do not allow airports to expand if you want to meet your Carbon budget.

What about improvements to make the aviation industry more sustainable

Sustainable fuel for example.. – At the World Economic Forum in Davos January this year, the corporate signatories of ‘Clean Skies for Tomorrow’ pledged to…… ‘achieve sustainable aviation fuel blend of 10% in global jet fuel supply by 2030. … That means by 2030 – 90% of aviation fuel will still be  fossil fuels!

The International Energy Authority (IEA) commented in Sept 2022 – ‘renewable synthetic Kerosene is relatively far from commercialisation’

What about improved Aircraft Design

The International Energy Authority (IEA) in Sept 22 talks about better aircraft designs reducing GHG emissions but state… ‘New aircraft are more efficient – but this has been insufficient to keep up with growth demand’.

What about Economics

I think the expansion of Gatwick airport will harm Eastbourne’s economy by allowing more Brits to travel abroad rather than staying in the UK to holiday.

Summary

I ask you to publicly and strongly reject Gatwick’s request to support their expansion. To do otherwise would make your declaration of Carbon Neutral 2030 a sham!

The Aviation Industry is not sustainable and will not be for at least a quarter of a century.

David Everson: Chair EEAN Transport Group to the Full Council


Driving to Airbourne

In Eastbourne Borough Council’s commitment to a carbon neutral 2030 one of the most contentious sources is Airbourne. An issue where some councillors have resigned. However their recently published report, on the event’s 2022 carbon footprint, showed that 96% was down to ‘audience’ travel. Whereas very little was linked to the aircraft

During the event the council undertook a survey of 710 people. They found 74% came by private car. Using Kolin Schunks carbon tool these journeys accounted for 95% of all the ‘travel’ CO2e. This being 91% of the CO2e for everything at Airbourne.

To be fair 2022 was not typical and due to industrial action had less rail travel but the clear message is, even in a ‘normal’ year, most carbon will be down to private car trips.

People might think that with more electric vehicles the carbon footprint will become very much less. However EVs with low mileage have big manufacture and disposal carbon footprints. With a trend for being ever larger and 15% heavier, than the fossil fuel equivalent, they are not the solution for everything and they still take up the same road space

Then with the raw data it was possible to have a ‘rough and ready’ estimate for traffic. Where assuming up to 10km was driven in Eastbourne and within 40km in East Sussex. This showed only 13%, of the total distance driven, is within Eastbourne and a further 21% elsewhere in East Sussex. So most of the event’s CO2e is not directly linked to the Eastbourne area.

Below are some of the measures that would reduce car trips. Experts suggest it is not enough to only use ‘pull’ measures like cycle and bus lanes. There has to be ‘push’ measures, which are equally important for the rest of the year.

Graphic from TUMI

TUMI

So in conclusion, if Eastbourne wants to reduce the carbon footprint for Airbourne, they need to discourage car trips. They would have to implement measures such as car bans, higher parking charges and tighter parking management. The question is does anyone have the commitment to do this?

Paul Humphreys – Transport Group


Should Strategies be Realistic?

How should local government present their plans for a greener future? Is it better for them to be realistic or else have a vision that, with only limited interventions, will not be achieved? Let’s look at transport but the same is applicable for other carbon strategies.

The various local government organisations, adopt different approaches, as to the strategies they produce. Transport for South East in their modelling, do not hide away from scenarios where active travel (buses, pedestrians and cycling) actually declines. Below is a projection for 2050 called ‘Our Route to Growth’. [Note the cycle logo includes pedestrians.] Following their recent consultation, TfSE agreed to slightly modify their Investment Plan. However the point is, their models are indicative of what may happen, and not necessarily what campaigners might like.

The more problematic approach is when local government, include in their plans, what you would like, but there is no past or future evidence that these will happen. As an example, there are repeated references to the reduction of cars in local borough and county plans. This is against the backdrop of East Sussex County Council predicting, in their A22 A2290 review,  an increase in traffic of 15% from now to  2039.

So in the new draft Eastbourne Local Plan, it refers to a 15% reduction in car journeys. This is extremely optimistic. As is elsewhere, a 10% modal shift from 70% trips by car to 60%. This is in the ‘Hailsham Polegate Eastbourne corridor’ and would be offset by a 150% increase in cycling, 125% in bus trips and 60% more walking. Even those who have little experience in transport, will realise, what a colossal task this would be. As background, there has never been a decrease locally in car trips. Plus cycling and bus trips have reduced over the last twenty years.

So what can be done to prevent unrealistic predictions. TfSE have a clear requirement to monitor and evaluate any targets. This could be used elsewhere, to hold any predictions to account, such as large reductions in car journeys.

In summary, campaigners should request that ‘over ambitious claims’, although they may initially be welcome, should have a realistic delivery plan behind them

Paul Humphreys EEAN – Transport Group, Bespoke, Cycle East Sussex