Airbourne Travel Carbon Footprint 2026

Introduction

Eastbourne Eco Action Network (EEAN) Transport Group in 2026 has once again undertaken a survey of the carbon footprint of the audience, going to and from Airbourne, which is also referred to as the Eastbourne Airshow.

This year more effort was spent on working out the whole travel footprint of visitors who have spent many days in the area and from this data allocating one day’s worth to their trip to Airbourne on top of what they did on the day. There was  also a decision taken  to work out both the direct emissions ( Tank to Wheel) as well as the total lifetime footprint. By doing this the baseline assumptions from our 2025 survey have not been adhered to. Most importantly by capturing more trips and mileage, than before ,the numbers in some scenarios have increased.

So last year I wrote “[Shortcomings were …. Mainly around more accurately analysing people who are coming to Airbourne from the holiday location and not directly from their home….. this is a blue print for what we could do in 2026 to improve the research.

This year’s estimated Carbon footprint for 2026 is **4543**  tonnes of CO2e . However in this report other totals are mentioned

Background

EBC’s Events Department for 2024 stated “[We] work pro-actively in our approach to sustainability at all of our events including Airbourne. We strive to ensure that sustainability is at the forefront of our decision making as opposed to being an afterthought. Airbourne brings a significant number of people into our town over the course of four days and we try our best to make our event carbon friendly.

democracy.lewes-eastbourne.gov.uk/documents/s39059/100+Eastbourne+Carbon+Neutral+2030+Annual+Update+Report.pdf

Where for comparison and context for Airbourne “Greenhouse gas emissions across the Eastbourne borough continue to go down leading to a total of 257,000 tonnes CO2e emitted in 2023”

From 2023/24 “Only 3.7% of emissions generated by Airbourne are from the flying display aircraft. In fact, all of the displays in total generate less than a one-way flight to New York! The biggest generator of all emissions is actually from the people travelling to events, with 96.1% of all emissions at Airbourne 2022 generated by audience related travel, and just 0.2% from other sources.”

The 750,000 visitor figure for the Eastbourne Airbourne International Airshow is considered a ‘low-confidence estimate’ because it is an uncounted, un-ticketed free event spanning a massive two-mile open seafront. However if this remains constant it makes year on year comparisons easier. The council relies on small-sample visitor surveys to gauge attendance. For instance, in their carbon neutral reporting, they explicitly state they estimate audience travel metrics based on a fixed boilerplate assumption of 750,000 people. The small sample size issue is even more acute for EEAN where only 140 surveys were undertaken. One or two visitors coming from the other side of the world makes numbers unreliable.

Methodology

This years survey identified those who were on holiday for a number of days and worked out this carbon footprint  and alloacted based on one day, when they are at Airbourne. Then worked out the footprint of the day itself.  So as an example if someone drove on a 300 mile journey to Sussex. Their return journey would be for 600 miles and if they stayed 6 days each day has a 100 mile ‘share’. If they stayed in a local hotel, on the seafront, they might walk there and have a carbon footprint of 0 on the day.

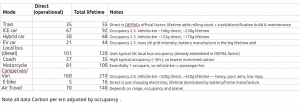
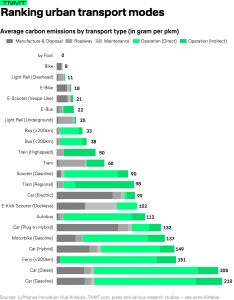
Below are the carbon footprint in gms per passenger per kilometre. However, based on this sample, adjusted for the following occupancy rates. Cars 2.5 , CamperVans 2.0. Others, such as Buses, Coaches and Trains,  using commonly used factors. Direct is the ‘Tank to Wheel’ and excludes power generation and oil refining. Total Lifetime is all of the previous but also manufacture, disposal, spares etc..
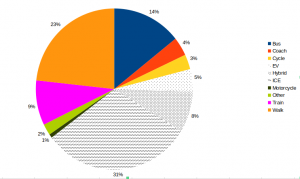
So in the survey sample of 140 this is the carbon footprint by share. This Pie Chart is the split on the day they attended Airbourne. Note the large share for walking. The reasons are local people in town popping in, visitors who drove down but staying with locals, friends, family or in a hotel.
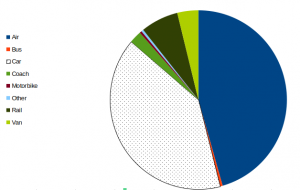
Then the share of carbon for the holiday. Note how the amount for Air is huge. This may be a distortion based on a few very long flights from the other side of the world.
So the calculations can be complex but here are the carbon footprints for all those in the sample using 1 method, in gm CO2e . Then aggregated to Kg and finally to scale up to 750,000 visitors in tonnes CO2e.
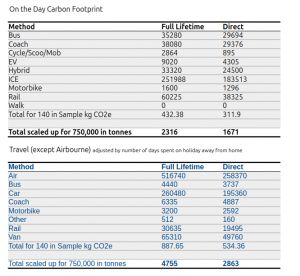
Full Lifetime footprint.

This is not a methodology that the Government would use, where they may show electric trains and electric vehicles with zero footprint. It may be useful to look at the below to see how Full Lifetime can be arrived at. In our sample the total is **7071** tonnes CO2e. However this allocation of huge mileage from long overseas trips to Airbourne may not be ‘fair’. However the total is still of itself interesting.
Paul Humphreys – Main Author

Thanks to other members of EEAN who helped collect the data
Making business a force for good

At our recent Carbon Neutrality Symposium held at Eastbourne Town hall on 20th April, our keynote speaker, Richard Garland, a prominent local business owner, gave an inspirational talk about how local businesses can make a very significant contribution towards Eastbourne becoming a truly Carbon Neutral town by 2030. Below is an abridged version of his speech:

 Good afternoon, everyone. I am Richard Garland, and amongst other things I am co-founder of Gradient Consultants. We are chartered surveyors, project managers and compliance consultants, based here in town since 2004. Some of our projects you may be familiar with include the Fishing Quay development on Sovereign Harbour, Costa Drive-thru on Hampden Retail Park and the affordable rental flats in Southfields Road. In 2020 we certified as a B-Corp, the first independent company in Eastbourne and one of the first UK built environment professional firms to do so. B-Corp is a global movement transforming the economy to benefit ALL – people, communities and the planet. We still have to make a profit but the way we go about it isn’t about making profit at any cost – everyone has to benefit along the way. 
Our purpose is our commitment to making a positive impact on the world. As a certified B-Corp, our values are deeply rooted in sustainability, social responsibility, and ethical business practices. We believe what we do in the next 7 years leading up to 2030 really matters and now is the time to act, with our industry being responsible for over 40% of the UK’s carbon emissions. We consider ourselves carbon neutral through our support of Ecologi. Ecologi®  have achieved the Verified Carbon Standard (VCS) and have been our offsetting partner for a number of years. We currently offset the business and personal emissions for all our people . We support tree planting and ecological schemes across the world. In the last 3 years we have offset 138 tonnes of carbon, planting over 2000 trees, and supported global sustainable projects. Our goal is to retain this off- setting, regardless of emissions reduction , but bring it closer to home, which we have already started to do by supporting planting on the Eastbourne escarpment. But we want to go further…

In 2022 we decided to set our ambitions on Net-Zero by 2030. We recognised that at some point in the not too distant future Net Zero will be the new carbon neutrality, so we wanted to be ahead of that journey. We started looking at data collection. I cannot begin to tell you how many articles on how to measure, what to measure, and when to measure from, we read – and at one point we got analysis paralysis – just stuck! And it took a friend to simply say stop thinking and just do something, anything – even if it is simply to walk to work and then make that your first action! This was a bit of a light bulb moment and as long as we could evidence a robust source of data it was worth doing something positive, rather than worrying over the how! We looked and celebrated what we were already doing, which included recycling pretty much everything, making sure our unwanted IT equipment and furniture goes into the circular economy, and pushing our clients to install bee bricks, swift boxes and fruit trees onto their development sites. 

Calculating our Scope 1 and 2 emissions was relatively straightforward for us as a professional services business so I won’t dwell too much on it- the biggest change is the utility companies will help you with this so it is much easier to deal with. In conjunction with our landlord we now have an office that has solar panels, LED lighting, infra-red heating panels, additional roof insulation and film on the windows to reduce solar gain. As for the dreaded Scope 3 emissions, for a firm such as ours this is where the majority of our emissions lurk and a challenging area for organisations in terms of data collection and carbon reduction initiatives. From travel to water to the things we buy, the list was long but eventually we agreed a more manageable list of priority measures, assisted by Small99. Our Pathway to Net Zero covers short and longer term planned activities to reduce our business ‘and personal’ GHG emissions, as well as push for a greater reduction in the emissions of the projects and services we advise on and can influence. At the last count there were 50 + ideas and actions. The priority ones get a champion, an estimated date for achievement and the emission saving impact. As a result we now use local suppliers as a priority. Local sourcing helps us reduce our carbon footprint and supports our community and local economy. We specify nature based materials, including hemp, lime and we now specify Graphenstone paint for all our projects. This paint absorbs CO2, removes pollutants to purify the air and as a mineral based paint it contains no microplastics. We hold our business event at venues close to a train station to encourage guests to make sustainable travel choices.

And we waved goodbye to our computer server in October last year, which was no longer needed since moving to the cloud as one of our reduction actions. The server had been running continuously for 6 years and by retiring the server we are saving 118 kgCO2e per year. The biggest impact on the list we are currently addressing is banking and pensions. Moving these financial instruments has the potential to have the greatest impact of all – a sustainable pension is 21 times more powerful than giving up flying, becoming vegetarian and switching to renewable energy.  Our goal is to make a 10% CO2e reduction year on year from 2024 to 2030. This will have reduced our overall emissions by 70% by 2030. With the Scope 1 and 2 emissions reduction prior to 2023 we believe we can achieve the necessary reduction in emissions to at least try and hit Net Zero by 2030.

So why do this, what and who benefits? B-Corp gave us ‘a legal high, we started to see ourselves as activists and ethical leaders. For us it is a climate justice choice . As a business we are de-risking the need to meet current and future compliance requirements within our industry , and we are acknowledging the opportunities of the low carbon transition – the green economy. For example, retrofitting the UK’s existing building stocks, measuring the Whole Life Carbon costs on construction projects, and the impact of Net Zero building standards, are all opportunities for sustainable growth and meeting future Department for Energy Security and Net Zero targets. Clients need us to have taken action because their funders (banks, pension funds, government) will be demanding it of them. We are influencing our supply chain to take action before they require it of us and we are offering to assist them with that change – openness, sharing ideas and transparency will make the journey go quicker! And to close, my advice to anyone at the beginning or on this journey is: do not over-strategise and get stuck in the data. Imagine if we did nothing and just talked about it? Look at what you have done so far, celebrate it and then take another step on your journey – be a force for good whatever you do!

We are grateful to Richard for kindly making available a full transcript of his speech, as well as the slideshow to accompany it.

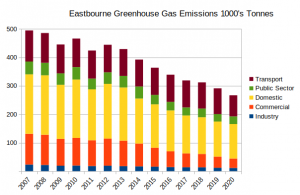
Greenhouse Gas Emissions in Eastbourne drop 8% for 2020

Eastbourne Greenhouse Gas emissions for 2020 continue to decrease, as they have done for the last 15 years. Some of this is down to a 5% trend, year on year, and some of it is Covid. However the question is will it be enough ?

The latest national statistics for 2020 have been published. Everybody expected a big decrease due to the pandemic. However it still looks like at this rate the 2030 target for Eastbourne remains a long way off. An 8% reduction in 2020 is in the right direction but as life goes back to normal, following the pandemic, it will be interesting to see the data for 2021, published in a year’s time.


The Tyndall Centre analysis  believes 8% is not enough and says Eastbourne should  “Initiate an immediate programme of CO2 mitigation to deliver cuts in emissions averaging a minimum of 12.3% per year to deliver a Paris aligned carbon budget.”

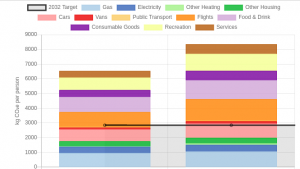
Emissions per capita, for Eastbourne, using the Government methodology are 2.5 tonnes per person. This is a narrow scope as  it does not include the wider carbon footprint, such as  the transportation  and manufacture of imported goods.

An analysis that includes more is at Carbon Place  ( filter on Eastbourne) where the carbon footprint per person is 6.5 tonnes a person. ( left hand column for Eastbourne right hand is UK average ) Plus there is a useful breakdown of the embodied carbon consumption of each area of Eastbourne. It also reveals the gross inequality of carbon footprints between the richer and poorer parts of the town.

“Nationally transport greenhouse gas emissions saw a decrease of 18% in 2020 compared to 2019. This was largely due to the impact of the COVID-19 pandemic as people stayed at home for large periods of 2020. Despite this large fall, transport remains the sector with the highest greenhouse gas emissions in many local authorities.”

In conclusion the 2030 Eastbourne carbon neutral target seems a long way from being reached. There needs to be a stronger commitment to climate action. This is across the community, with ever deeper collaboration between councillors, council officers, businesses and community groups to ensure that the transition away from dependence upon fossil fuels is as fast as possible

Authors – Paul Humphreys and Andy Durling