
Introduction
Eastbourne Eco Action Network (EEAN) Transport Group in 2026 has once again undertaken a survey of the carbon footprint of the audience, going to and from Airbourne, which is also referred to as the Eastbourne Airshow.
This year more effort was spent on working out the whole travel footprint of visitors who have spent many days in the area and from this data allocating one day’s worth to their trip to Airbourne on top of what they did on the day. There was also a decision taken to work out both the direct emissions ( Tank to Wheel) as well as the total lifetime footprint. By doing this the baseline assumptions from our 2025 survey have not been adhered to. Most importantly by capturing more trips and mileage, than before ,the numbers in some scenarios have increased.
So last year I wrote “[Shortcomings were …. Mainly around more accurately analysing people who are coming to Airbourne from the holiday location and not directly from their home….. this is a blue print for what we could do in 2026 to improve the research.”
This year’s estimated Carbon footprint for 2026 is **4543** tonnes of CO2e . However in this report other totals are mentioned
Background
EBC’s Events Department for 2024 stated “[We] work pro-actively in our approach to sustainability at all of our events including Airbourne. We strive to ensure that sustainability is at the forefront of our decision making as opposed to being an afterthought. Airbourne brings a significant number of people into our town over the course of four days and we try our best to make our event carbon friendly.”
democracy.lewes-eastbourne.gov.uk/documents/s39059/100+Eastbourne+Carbon+Neutral+2030+Annual+Update+Report
From 2023/24 “Only 3.7% of emissions generated by Airbourne are from the flying display aircraft. In fact, all of the displays in total generate less than a one-way flight to New York! The biggest generator of all emissions is actually from the people travelling to events, with 96.1% of all emissions at Airbourne 2022 generated by audience related travel, and just 0.2% from other sources.”
The 750,000 visitor figure for the Eastbourne Airbourne International Airshow is considered a ‘low-confidence estimate’ because it is an uncounted, un-ticketed free event spanning a massive two-mile open seafront. However if this remains constant it makes year on year comparisons easier. The council relies on small-sample visitor surveys to gauge attendance. For instance, in their carbon neutral reporting, they explicitly state they estimate audience travel metrics based on a fixed boilerplate assumption of 750,000 people. The small sample size issue is even more acute for EEAN where only 140 surveys were undertaken. One or two visitors coming from the other side of the world makes numbers unreliable.
Methodology
This years survey identified those who were on holiday for a number of days and worked out this carbon footprint and alloacted based on one day, when they are at Airbourne. Then worked out the footprint of the day itself. So as an example if someone drove on a 300 mile journey to Sussex. Their return footprint would be for 600 miles. If they stayed in a local hotel, on the seafront, they might walk there and have a carbon footprint of 0 on the day.
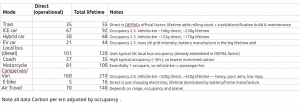
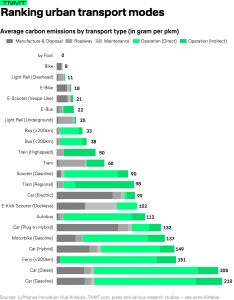
Below are the carbon footprint in gms per passenger per kilometre. However, based on this sample, adjusted for the following occupancy rates. Cars 2.5 , CamperVans 2.0. Others, such as Buses, Coaches and Trains, using commonly used factors. Direct is the ‘Tank to Wheel’ and excludes power generation and oil refining. Total Lifetime is all of the previous but also manufacture, disposal, spares etc..
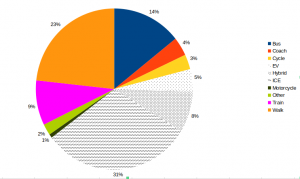
So in the survey sample of 140 this is the carbon footprint by share. This Pie Chart is the split on the day they attended Airbourne. Note the large share for walking. The reasons are local people in town popping in, visitors who drove down but staying with locals, friends, family or in a hotel.
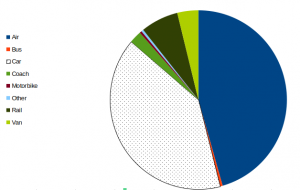
Then the share of carbon for the holiday. Note how the amount for Air is huge. This may be a distortion based on a few very long flights from the other side of the world.
So the calculations can be complex but here are the carbon footprints for all those in the sample using 1 method, in gm CO2e . Then aggregated to Kg and finally to scale up to 750,000 visitors in tonnes CO2e.
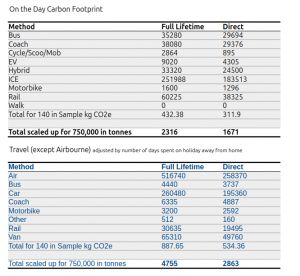
Full Lifetime footprint.
This is not a methodology that the Government would use, where they may show electric trains and electric vehicles with zero footprint. It may be useful to look at the below to see how Full Lifetime can be arrived at. In our sample the total is **7071** tonnes CO2e. However this allocation of huge mileage from long overseas trips to Airbourne may not be ‘fair’. However the total is still of itself interesting.
Paul Humphreys – Main Author
Thanks to other members of EEAN who helped collect the data